
Scientific journal
European Journal of Natural History
ISSN 2073-4972
ИФ РИНЦ = 0.204
MATHEMATICAL MODELLING OF WORKFORCE POTENTIAL

Regional economic system workforce economic potential estimate has a great practical application. It’s driven by need for precise analysis and correct prognosis of regional economic system status in order to develop social and economic policy of the region. Of note, workforce potential economic analysis and life valuation are deemed to be one of the most important economic demography growth areas [1, 2]. Estimates of the value of life and economic cost of health loss were put forward at [3]. The matter of an economic equivalent of the human life is being discussed in [4–6] studies as well. Researches in this field are especially relevant nowadays [7–9].
Purpose
The purpose of this activity is to estimate regional socio-economic system workforce in terms of analyzing its economic potential, and to evaluate region’s economy cost-effectiveness and realized economic potential of a worker through mathematical and economical constructions as exemplified by one the regions of the Russian Federation.
Materials and research methods
Workforce potential estimate directly entails demographic dynamic problem solution [10]; demographic dynamic defines workforce size of a region, considering demographic elements’ age stages (fig. 1).
Age stages are taken into account while modelling regional system profile. While modelling workforce economic potential estimate, it had been assumed that within every age stage, average demographic entity with its defining average statistical values is used. Men’ and women’ economically active period, as well as their contribution to the public production, is assumed to be equal.
Since per capita financing is in place, budget rate of consumption distribution is carried out taking into account demographic elements’ distribution density within every age stage.
Let’s estimate national cost recovery of average demographic element to the age of τ, considering the probabilistic nature of time left to live.

Fig. 1. Demographic elements’ age stages
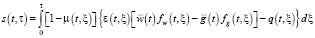
Let’s define s(t, τ) as national cost recovery function (accumulated balance). Its calculation formula is of the form:
 . (1)
. (1)
Formula (1) designations are: µ(t, ξ) – demographic elements’ withdrawal function (we consider the probabilistic nature of time left to live with the benefit of this function in formula (1)), ε(t, ξ) – function which defines a certain share of demographic elements of an age of ξ, engaged in a labour activity within a year t. Term  refers to an economic potential of an average worker, provided that w(t, ξ) – value added per one average worker of an age of ξ in the year t function,
  averaged over all ages value added function, fw(t, ξ) – normalized distribution scale of a produced average unit value added depending upon worker’s age. Term
  ensuing estimated wage, as well as estimated public foundations’ cash payments, provided g(t, ξ) – wage per average worker of an age of ξ in the year t function,
  wage averaged over all ages function, fg(t, ξ) – normalized distribution scale of a produced average unit wage depending upon worker’s age. Function q(t, ξ) – budget expenditure distribution by demographic elements’ cohorts.
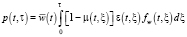
Let’s write down average worker’s economic potential accumulated by the certain age τ:
 . (2)
. (2)
Normalized distribution scales of an average unit value added fw(t, τ) and average unit wage value fg(t, τ) based on articles [1, 10] are presented in Fig. 2. Let 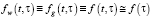 .
.
Let average values  of an added value w(t, τ) per average worker of an age of τ in the year t and wage amount per average worker of an age of τ in the year t g(t, τ) respectively to be of the forms:
 , (3,a)
 , (3,b)
where τm is a maximum reported age at death.
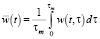
Let us introduce the following definitions: W(t) – value added in the year t; G(t) – wage amount in the year t, εw(t, τ) demographic elements’ of an age of τ who made up  or (G(t)) value in the year t, whereas
  .
.
Since for normalized scales  could be rewritten as
  , the following equations take place:
 , (4, a)
 , (4, b)
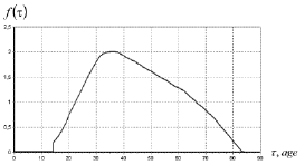
Fig. 2. Normalized distribution scale of an average unit value added depending upon demographic element’s age
 , (5, a)
 , (5, b)
 , (6, a)
 . (6, b)
As far as production facilities dynamics equation K(t) with an amortization coefficient η, written down by means of gross regional product (GRP) value Y(t), produced in the year t (e.g. [11]), is of the form:
 , (7)
, (7)
formula (6,a) used for figuring average value added produced by an average worker of the age of τ in the year t, could be rewritten as:
 . (8)
. (8)
Let’s now define a function q(t, τ), which is contained in a formula (1) and represents budget expenditure dispersion by demographic elements’ cohort. In accordance with [9], it’s calculated via the following formula:
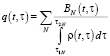 , (9, а)
 (9, b)
Formula (9, а, b) definitions are: BN(t) – size of funds of an N th budget line, that addresses social and economic development; ρ(t, τ) – population distribution density within every age stage in the year t,  different life periods during which he exerts to material means of one N th regional budget line or another; Alignment of budget lines that address social and economic development can be found in [11].
Research results and deliberations
Thereby, all components which make up formulas (1) and (2) are set. Now we can calculate cost recovery of a demographic element to an age of τ with probabilistic nature of time left to live taken into account, as well as an economic potential (2) of an average worker, accumulated by the certain age τ.
Here are some calculations as exemplified by regional Udmurt Republic (UR) system for the year 2018 according to data provided by an Official statistics section (National accounts, Population, Entreprising subsections) of Goskomstat website [12] and by Budget performance section (“Russian Federation territorial entities’ consolidated budgets” subsection and “Community-based state non-budgetary funds of Russian Federation territorial entities” subsection) at the Federal Treasury website [13].
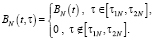
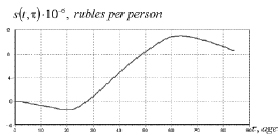
Fig. 3, а presents cost recovery (the amount of an accumulated balance) graph s(t, τ) of an average demographic element to the age of τ. Fig. 3, b presents demographic element economic potential distribution according to the age.
Function graph exceeds negative values at point τ = 28 (fig. 3, а) which corresponds to the age of a demographic element. Henceforth, positive balance for an economy of a region emerges, made by the difference between expenditures and labour effective output of a demographic element. In case of his withdrawal after τ = 28, direct regional economic damage occurs as expected labour effective output doesn’t overcome the expenditure and therefore is at loss.
a)
b)
Fig. 3. а) Benefit, provided to the Udmurt Republic economy by demographic element to the age of τ (where t = 2018); b) Realized economic potential of a demographic element to the age of τ (where t = 2018)
Economically active population shrinks down to the age of τ = 60; however, the curve does not leap. The reason for this is that a certain share ε(t, τ) of demographic elements continues the labour activity and still takes part in forming the value added during that span.
Part of the value added by demographic element at a time of active working life is being distributed over pension payments, therefore accumulated balance declines.
Calculations (as shown in fig. 3, a) also indicate that as of 2018, profit brought by demographic element to region’s economy amounts to 8,8 million rubles; notably, maximal labour productivity (11,2 million rubles) is reached at the age of τ = 63÷64.
Economic potential of a demographic element (e.g. fig. 3, b) comes to fruition starting from the age of τ = 22, and becomes a constant value at the age of τ = 70.
Conclusion
This way, the mathematical estimation of a regional economic system workforce potential was obtained. We’ve built formulas which enable us to estimate worker’s regional cost-effectiveness expressed in monetary terms, and to estimate worker’s realized economic potential. Numerical calculations are evaluated by means of one of Russia’s regions – the Udmurt Republic; it represents a typical Russian region [14] for a number of socio-economic properties, which are defined by national average values. Therefore, calculations available from the research by means of studying certain economical indicators can be extrapolated to the Russian Federation altogether. Obtained results and conclusions can be exploited further during a thorough socio-economic analysis of a regional system.
Библиографическая ссылка
Кетова К.В., Русяк И.Г., Вавилова Д.Д. MATHEMATICAL MODELLING OF WORKFORCE POTENTIAL // European Journal of Natural History. 2020. № 3. ;URL: https://world-science.ru/en/article/view?id=34088 (дата обращения: 25.06.2026).
DOI: https://doi.org/10.17513/ejnh.34088