
Scientific journal
European Journal of Natural History
ISSN 2073-4972
ИФ РИНЦ = 0.204
PROBABILISTIC-STASTIC METHOD IN PEDAGOGY (PART II): SCALING AND EXPERIMENTAL RESEARCH

While carrying out a pedagogic research, a great attention is paid to the problems of scaling. To estimate a research object traits in pedagogy, various scales are used. Their selection in each specific case proves to be a difficult task. In accordance with the modern estimation theory, scales are often classified by types, for example, scales of names, order, intervals, relations, and differences are distinguished. In Russian education system while estimating a knowledge completeness nowadays five-unit ordinal rating scale is implemented, its main advantage is its simplicity and habitualness. However, it also has some significant disadvantages, to which, because of the narrow rating interval (2-5 units), we can refer low differential ability and high estimation inaccuracy (Δσ = ±0,5 unit).
In order to decrease the relative estimation inaccuracy some transfer to ten-, twelve-, twenty-, and one hundred-unit scale. It, no doubt, increases an estimation accuracy, but does not provide us with new qualitative results. The solution of this problem greatly depends on the success in the way of an adequate student model development. Some definite hope here is linked to the probabilistic-statistic student model [1, 2], and, therefore, to the probabilistic-statistic method of a knowledge completeness estimation [3, 4].
Probabilistic-statistic method of a knowledge completeness estimation
In [1] it has been shown, that within his education process a person moves within the informative space, and his behavior is associated to the behavior of some distribution function Ψ(σ; t) that reflects a probability density in other words, the probability to allocate a student in a singular coordinate interval of the informative space in a time moment t. So, a student estimation problem, in fact, comes to finding his individual distribution function with usage of probabilistic-statistic scaling. Let us study some major aspects of probabilistic-statistic scaling.
According to the evaluation scale [3] an ordinal system ![]() is mentioned. Here A is some ordered object (individual) totality, these individuals carry some traits that interest us (empiric system with relations); Lψ is a functional space (space of distribution function Ψ(σ; t)) with its relations; F is an operation of homomorphic imagery of A into the subsystem Lψ; G is the possible alterations group; f is an operation of the distribution function Ψ(σ; t) from the subsystem Lψ upon digital systems with relations of n-mensural space M. Operation f was introduced as it is relatively hard to work with distribution functions within a functional space. In order to simplify it a transfer from functional into digital space is carried out. It is supposed, that each distribution function can be set in accordance with a number of digital values {μn(t)}, moments of the distribution function from zero to an unlimitedly large order (n = 0, 1, 2, 3, ...). It is also supposed, that a reverse problem can be solved - the reconstruction of the distribution function Ψ(σ; t) on the defined moment number {μn(t)}.
is mentioned. Here A is some ordered object (individual) totality, these individuals carry some traits that interest us (empiric system with relations); Lψ is a functional space (space of distribution function Ψ(σ; t)) with its relations; F is an operation of homomorphic imagery of A into the subsystem Lψ; G is the possible alterations group; f is an operation of the distribution function Ψ(σ; t) from the subsystem Lψ upon digital systems with relations of n-mensural space M. Operation f was introduced as it is relatively hard to work with distribution functions within a functional space. In order to simplify it a transfer from functional into digital space is carried out. It is supposed, that each distribution function can be set in accordance with a number of digital values {μn(t)}, moments of the distribution function from zero to an unlimitedly large order (n = 0, 1, 2, 3, ...). It is also supposed, that a reverse problem can be solved - the reconstruction of the distribution function Ψ(σ; t) on the defined moment number {μn(t)}.
Zero order moment ![]() defines a probability to allocate a person within the whole informative space and, therefore, equals one. The first order moment
defines a probability to allocate a person within the whole informative space and, therefore, equals one. The first order moment ![]() defines the mathematic expectation (an average value of σ, the coordinate of the distribution centre). Moments of n-order (n > 1) look like
defines the mathematic expectation (an average value of σ, the coordinate of the distribution centre). Moments of n-order (n > 1) look like ![]() . Moments of even orders characterize a distribution function smearing, and non-even order moments - an asymmetry of a distribution function relatively to its mathematic expectation.
. Moments of even orders characterize a distribution function smearing, and non-even order moments - an asymmetry of a distribution function relatively to its mathematic expectation.
Thus, in order to define students´ knowledge completeness and rate them according to their knowledge level is necessary to undertake the following actions: experimentally find, according to the results of a control measure, for example, an exam, individual students´ distribution functions; calculate individual distribution functions moments; carry out students´ rating according to their knowledge level through comparing different order moments of their individual distribution functions.
Experimental research
The maximum student´s advancement within an informative space per one education discipline in the traditional five-unit evaluation system equals five points. It, as mentioned above, leads to a high relative inaccuracy while estimating a student´s knowledge completeness. In order to decrease the inaccuracy while estimations a knowledge completeness in [3], twelve-unit system and probabilistic-statistic scaling was used.
In table 1 some typical results of students´ knowledge completeness evaluation are shown. They reflect a knowledge on a general physics course and were obtained with the method of probabilistic-statistic scaling for all four traditionally-accepted knowledge levels (marks «excellent», «good», «satisfactory», «unsatisfactory»). In the table columns probability (in percents) of students´ knowledge «allocation» in a certain informative space coordinate interval is shown. Each line is in fact a distribution function in percents. It simplifies the evaluation procedure, without changing its essence.
Table 1
The results of students´ knowledge completeness evaluation according
to the probabilistic-statistic method
Moments of distribution functions that are provided in table 1 are placed in table 2. Ordinal numbers in the corresponding divisions of table 1 and 2 are same
|
№ п/п |
Interval scales, points |
|||||||||||||||||||
|
0-1 |
1-2 |
2-3 |
3-4 |
4-5 |
5-6 |
6-7 |
7-8 |
8-9 |
9-10 |
10-11 |
11-12 |
12-13 |
13-14 |
14-15 |
15-16 |
16-17 |
17-18 |
18-19 |
19-20 |
|
|
Traditional mark «5» (excellent) |
||||||||||||||||||||
|
1 |
10 |
30 |
30 |
20 |
10 |
|||||||||||||||
|
2 |
10 |
30 |
40 |
20 |
||||||||||||||||
|
3 |
10 |
20 |
20 |
20 |
20 |
10 |
||||||||||||||
|
Traditional mark «4» (good) |
||||||||||||||||||||
|
1 |
20 |
60 |
20 |
|||||||||||||||||
|
2 |
10 |
20 |
50 |
20 |
||||||||||||||||
|
3 |
20 |
50 |
20 |
10 |
||||||||||||||||
|
Traditional mark «3» (satisfactory) |
||||||||||||||||||||
|
1 |
20 |
50 |
30 |
|||||||||||||||||
|
2 |
10 |
30 |
40 |
20 |
||||||||||||||||
|
3 |
10 |
20 |
20 |
20 |
20 |
10 |
||||||||||||||
|
Traditional mark «2» (unsatisfactory) |
||||||||||||||||||||
|
1 |
10 |
20 |
30 |
30 |
10 |
|||||||||||||||
|
2 |
10 |
20 |
40 |
20 |
10 |
|||||||||||||||
|
3 |
100 |
|||||||||||||||||||
The fact that each traditional mark corresponds with a wide range of mathematic expectation indexes allows us to carryout students´ rating according to their knowledge level within the limits of a mark. Besides, for an accurate rating higher distribution functions´ orders can be used. In [3] it is shown, that in majority of cases besides possessing a mathematic expectation index, it is enough to have an information on a second order moment, that defines a distribution function dispersion, and the third order moment, that characterize a distribution function asymmetry.
In article [5] within the five-unit knowledge evaluation system experimental distribution functions for each of 78 students, who studied for 5 years on one of the technical faculties of Moscow electronic technics institute, were found. On basis of this functions distribution function for this students´ stream were constructed (picture 1). The construction of students´ stream distribution functions was carried out within the concept of an individual distribution function additivity, that were approximated by rectangular functions. Mathematic expectation of an individual´ distribution function after n - semester was defined by an average sum of marks that a students got within n semesters on every education discipline, or:
![]()
where ![]() is an average mark that a student got in i - semester, and the function width equaled n points (after the first semester it equaled 1 point, after the second - 2 points, etc).
is an average mark that a student got in i - semester, and the function width equaled n points (after the first semester it equaled 1 point, after the second - 2 points, etc).
Table 2
Distribution functions´ moments
|
№ п/п |
Moment order |
||||
|
μ1, point |
μ2, point2 |
μ3, point 3 |
μ1, point 4 |
μ5, point 5 |
|
|
Traditional mark «5» (excellent) |
|||||
|
1 |
15,40 |
1,29 |
0,29 |
3,74 |
1,75 |
|
2 |
17,20 |
0,81 |
-0,14 |
1,48 |
-0,73 |
|
3 |
15,00 |
2,25 |
0,00 |
9,86 |
0,00 |
|
Traditional mark «4» (good) |
|||||
|
1 |
12,50 |
0,40 |
0,00 |
0,40 |
0,00 |
|
2 |
10,30 |
0,76 |
-0,34 |
1,55 |
-1,46 |
|
3 |
13,70 |
0,76 |
0,34 |
1,55 |
1,46 |
|
Traditional mark «3» (satisfactory) |
|||||
|
1 |
6,60 |
0,49 |
-0,05 |
0,50 |
-0,15 |
|
2 |
10,20 |
0,81 |
-0,14 |
1,48 |
-0,73 |
|
3 |
5,00 |
2,25 |
0,00 |
9,86 |
0,00 |
|
Traditional mark «2» (unsatisfactory) |
|||||
|
1 |
2,60 |
1,29 |
-0,29 |
3,74 |
-1,75 |
|
2 |
3,50 |
1,20 |
0,00 |
3,60 |
0,00 |
|
3 |
0,50 |
0,08 |
0,00 |
0,013 |
0,00 |
The analysis of data, provided in Figure, shows that, while advancing within an informative space, a distributive function diffuses. It happens because a mathematic expectation of individuals´ distribution functions moves with different speeds, and functions themselves diffuse because of dispersion. We should also outline, that a complete distribution function maximum within its evolution process moves from its left limit to the centre.
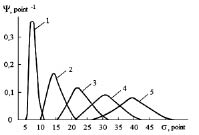
Evolution of the complete distribution function
of a students´ stream, approximated
by smooth lines:
1 - after the first course;
2 - after the second course;
3 - after the third course;
4 - after the fourth course;
5 - after the fifth course
Another important result is an overshot of distribution functions, especially evident on higher courses. It testifies that a knowledge volume, possessed by a weak higher course student (his individual distribution function is located in the «tail» of the complete distribution function), can be smaller than that of a strong younger course student.
The diffusion of experimental functions in time shows us a significant heterogeneity of a students´ subsystem. It leads to the fact, that from the third course, an education effectiveness in such groups decreases. In cases of large students´ groups or streams, tutors usually have to orient for average students within an educative process, and it affects both weak and strong students´ training under the terms of observed high distribution function dispersion. Strong students work worse than they are able to, and the weak ones are unable to master an education material. It leads to a greater heterogeneity of a student subsystem. Such situation forces tutors to lower their requirements while an assessment of students.
Resume
1. An effective method of students´ knowledge evaluation within their educative process is the method of probabilistic-statistic scaling. It allows us to carry out an accurate rating of students according to their knowledge level through the comparison of different individual distribution functions´ orders´ moments.
2. A research of experimental distribution functions implementation in time provides us with I important information on an education process condition, that, no doubt, proves to be useful for both students and tutor personnel, an educative institution administration, for an education process improvement and its structure optimization.
References
- Romanov V.P., Sokolova N.A. Probabilistic-statistic model of a student // Modern problems of science and education. - 2009. - № 6 (Part 3). - P. 122-129.
- Sokolova N.A. Education process: determination and randomness // International magazine of applied and fundamental research. - 2010. - №12. - P. 81-82.
- Romanov V.P., Sokolova N.A. Probabilistic-statistic scaling in pedagogy // Modern problems of science and education. - 2010. - № 2. - P. 57-63.
- Romanov V.P., Sokolova N.A. Probabilistic-statistic method of higher educational institution students´ knowledge completeness evaluation // International magazine of experimental education. - 2010. - №7. - P. 85-87.
- Romanov V.P., Sokolova N.A. The analysis of students´ behavior within an education process in a higher educational institution // Modern problems of science and education. - 2009. - №6 (Part 3). - P. 130-135.
Библиографическая ссылка
Romanov V.P, Sokolova N.A PROBABILISTIC-STASTIC METHOD IN PEDAGOGY (PART II): SCALING AND EXPERIMENTAL RESEARCH // European Journal of Natural History. 2011. № 3. ;URL: https://world-science.ru/en/article/view?id=28009 (дата обращения: 21.06.2026).