
Scientific journal
European Journal of Natural History
ISSN 2073-4972
ИФ РИНЦ = 0.204
STUDY OF CHICKPEA GENOTYPES (CICER ARIETINUM L.) RESISTANCE TO FUSARIUM DISEASE WITH DNA MARKERS

In Azerbaijan, there is a great need to create new pea varieties that meet modern requirements, are resistant to stress factors, diseases and pests, have high productivity and technological indicators for different regions of the Republic. As in other countries of the world, the main biotic factor that reduces the productivity of chickpeas in Azerbaijan is fungal diseases (ascochitosis, fusarium, olive mold, etc.). As a result of the lack of a gene resistant to all of these in plants, the resistance of plants decreases during the time.
Chickpeas ranks third in the world among leguminous plants by the size of cultivated areas [1]. The world average annual yield of chickpea is estimated to be about 105,78 kg/ha, which is lower than expected [2]. Low productivity is caused by biotic (Fusarium wilt, Aschochyta, nematodes, etc.) and abiotic stress factors together with a narrow genetic base [3-5]. Especially Fusarium oxysporum f. sp. is one of the most dangerous diseases that reduces productivity by 10-90% [6]. Cultivation of disease-resistant pea genotypes is the most effective method in the fight against Fusarium [7]. Using DNA markers closely linked to wilt resistance genes, it is possible to convert the genes into agronomically superior cultivars without actually exposing the genes to the pathogen. Marker-based sampling is an accurate, easy, and less time-consuming process than conventional methods. It has also been confirmed in previous studies that ISSR markers are more effective than RAPD markers [8, 9] Genetic studies confirm that resistance to race 4 is monogenic recessive [10]. A number of studies have been conducted to decipher the molecular marker closely related to Foc-4 resistance, and RAPD, SCAR, ISSR, STMS, etc. markers have been reported to be closely related to foc-4 [11]. In another study, it was found that most of the fusarium-resistant genotypes have the Foc01 resistance gene and the OPJ20 600 bp fragment [12]. Ratnaparkhe et al. (1998) associated disease resistance gene of UBC-825 ISSR primer and Tullu et al. (1999) reported that CS-27 and UBC-170 RAPD marker were associated with disease resistance.
The present study was conducted to investigate fusarium wilt resistance of 65 chickpea genotypes introduced from ICARDA both under field conditions and through RAPD and ISSR markers.
Material and methods of research
58 of the 65 chickpea genotypes selected for molecular characterization against Fusarium were introduced from the ICARDA genebank, and 8 samples were collected from different regions of Azerbaijan. Samples were grown in field conditions for 3 years and the response to Fusarium disease was determined, resistant, highly resistant, sensitive and highly sensitive samples were selected. Disease incidence and persistence were measured according to the IBU scale.
Immune (no fungus on plants)
Up to 10% – highly resistant
Up to 11-25% – moderate resistant
Up to 26-50% – moderate susceptible
More than 50% – susceptible
In order to group cultivars according to resistance to Fusarium disease, cluster analysis was performed based on the UPGMA (Unweighted Pair Group Method Using Arithmetic Average) method based on the Euclidean genetic distance.
Leaf samples for DNA extraction were taken 20 days after sowing. Genomic DNA was obtained from leaf tissue (2g) according to the CTAB method. The quality and quantity of extracted DNA was determined using a spectrophotometer. For the PCR mix, a 25 μl reaction volume contained 2.5 μl 10 X PCR buffer, 2 μl dNTP (5 mM), 2 μl primer (10 μm), 1.5 μl MgCl2 (50 mM), 0.2 μl Tag polymerase, and 20 The extracted DNA was used. PCR was performed under the following conditions: initial denaturation at 94 °C for 2 min, 40 cycles at 94 °C for 1 min, annealing at 50–55 °C for 45 s, annealing at 72 °C for 1 min, and a final denaturation at the same temperature for 7 min. PCR products were stained with ethidium bromide, electrophoresed on a 1.8% agarose gel, and documented using the BIO-RAD gel-documentation system. A molecular size standard of 1000 bp was used to measure the length of the fragments. The presence or absence of fragments synthesized with RAPD and ISSR primers was coded as (1) or (0), respectively (table 1).
Table 1
Name of DNA primers used in the study
|
RAPD primers |
Primer sequence |
Expected fragment length (bp) |
|
UBC 170 |
ATC TCT CCT G |
550 |
|
OPJ 20 |
AGT GGT CGC G |
855 |
|
A7C417 |
TAC TTA TAT CAT G |
417 |
|
R2609 |
AGAGAGAGAGAGAGAGG |
1600 |
|
USSR primers |
Primer sequence |
Expected fragment length (bp) |
|
UBC 811 |
GAGAGAGAGAGAGAGAC |
1250 |
|
UBC 825 |
ACACACACACACACACT |
1200 |
|
UBC 864 ACTG 4 UBC 855 |
ATGATGATGATGATGATG AGAGAGAGAGAGAGAGC ACACACACACACACACYT |
400 650 500 |
Results of the research and discussion
In this research work, the resistance of new cultivars of chickpea (Cicer arietinum L.) introduced from ICARDA to Fusarium diseases was studied based on structural analysis and phytopathological assessment (table 2). RAPD and ISSR primers were also used to distinguish between resistant and susceptible genotypes against fusarium.
In the present study, RAPD (UBC-170550, OPJ-20855, R26091600, A7C417) and ISSR primers (UBC-8251200, UBC-8111250 and ACTG4, UBC-864400, UBC-855500) previously reported to be associated with a disease susceptibility gene against fusarium used to distinguish resistant and susceptible genotypes [12, 6, 10]. The specific fragment expected with the primers used was synthesized only in susceptible genotypes. Thus, 417 n.c. with A7C RAPD primer, 550 n.c. with UBC-170 RAPD primer, 855 n.c. with OPJ-20 RAPD primer, 600 n.c. with R26091 RAPD primer attached to H2 locus. length fragment was synthesized. UBC-825 ISSR primer 1200 n.c., UBC 864 primer 400 n.c., UBC-855 primer 500 n.c., and UBC 811 primer 1250 n.c. in susceptible and moderately susceptible genotypes. gave a clause in length. These fragments were not observed in resistant and highly resistant accessions. (Figures 1, 2 and 3).
Using RAPD and ISSR primers, 44 points were synthesized for 65 chickpea samples, of which 38 points (86.3%) were polymorphic (table 3). On average, a total of 4.9 points were recorded with each primer, of which 3.3 points were polymorphic. The highest polymorphism was recorded with primer UBC-825, UBC-811 and A7C (100%), and the weakest polymorphism was recorded with primer R2609 (75%). The highest value of GMI was calculated with primer UBC 825 (GMI=0.95), and the lowest value was calculated with UBC 855 (GMI=0.33).
Table 2
The name of the samples used in the study and resistance to Fusarium
|
Specimen name |
Fusarium Continuity |
Specimen name |
Fusarium Continuity |
Specimen name |
Fusarium Continuity |
|
Flip13-24c |
Moderate resistant |
Flip13-55c |
Resistant |
Flip13-81c |
High durable |
|
Flip13-26c |
Moderate resistant |
Flip13-56c |
Susceptible |
Flip13-83c |
Susceptible |
|
Flip13-28c |
Resistant |
Flip13-57c |
Susceptible |
Flip13-86c |
Susceptible |
|
Flip13-30c |
Moderate resistant |
Flip13-58c |
Resistant |
Flip13-89c |
Resistant |
|
Flip13-31c |
Resistant |
Flip13-59c |
Resistant |
Flip13-93c |
Susceptible |
|
Flip13-32c |
Susceptible |
Flip13-64c |
Resistant |
Flip13-98c |
Resistant |
|
Flip13-33c |
Moderate resistant |
Flip13-65c |
Susceptible |
Flip13-102c |
Resistant |
|
Flip13-35c |
Resistant |
Flip13-66c |
Susceptible |
Flip13-105c |
Resistant |
|
Flip13-36c |
Resistant |
Flip13-67c |
Susceptible |
Flip13-106c |
Resistant |
|
Flip13-39c |
Resistant |
Flip13-69c |
Susceptible |
Flip13-108c |
Susceptible |
|
Flip13-43c |
Resistant |
Flip13-72c |
Resistant |
Flip13-109c |
Resistant |
|
Flip13-47c |
High durable |
Flip13-74c |
Resistant |
Flip13-120c |
Susceptible |
|
Flip13-48c |
Susceptible |
Flip13-75c |
Resistant |
Flip13-122c |
Moderate susceptible |
|
Flip13-50c |
Moderate susceptible |
Flip13-76c |
Resistant |
Flip13-123c |
Resistant |
|
Flip13-52c |
Resistant |
Flip13-78c |
Moderate susceptible |
Flip13-128c |
Resistant |
|
Flip13-53c |
Moderate resistant |
Flip13-79c |
Resistant |
Flip13-161c |
Resistant |
|
Flip13-54c |
Resistant |
Flip13-80c |
Resistant |
Qusar44 |
Resistant |
|
Flip06-8c |
Moderate resistant |
Flip 06-161 |
Moderate resistant |
Ağstafa42 |
Moderate susceptible |
|
Flip06-133c |
Moderate susceptible |
Flip 05-169c |
Moderate resistant |
Flip03-22 |
Susceptible |
|
Flip06-61c |
Moderate susceptible |
Ordubad 39 |
Moderate resistant |
Bakı30 |
Moderate resistant |
|
Abşeron34 |
Moderate resistant |
Ordubad 41 |
Moderate susceptible |
Cəlilabad11 |
Moderate resistant |
|
Flip 06-33c |
Moderate susceptible |
Qusar 43 |
Moderate resistant |
Nərmin |
Moderate susceptible |
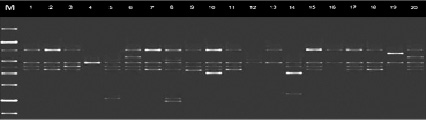
Fig. 1. Distribution of alleles synthesized by primer CS-27 among chickpea genotypes
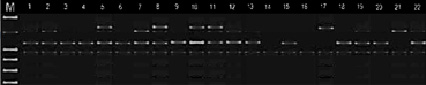
Fig. 2. Distribution of alleles synthesized by primer UBC 170 among chickpea genotypes
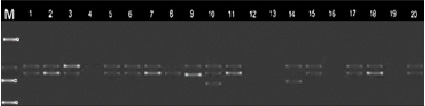
Fig. 3. Distribution of alleles synthesized by primer UBC 811 among chickpea genotypes
Table 3
Name of DNA primers used in the study
|
Primers |
Total number of bands |
Number of polymorphic bands |
Percentage of polymorphic |
Genetic diversity index |
PIC |
MI |
|
RAPD primers |
||||||
|
UBC 170 |
5 |
4 |
80 |
0,64 |
0,31 |
0,13 |
|
OPJ 20 |
6 |
5 |
83,3 |
0,71 |
0,14 |
0,17 |
|
A7C417 |
4 |
4 |
100 |
0,66 |
0,27 |
0,07 |
|
R2609 |
4 |
3 |
75 |
0,57 |
0,25 |
0,10 |
|
ISSR primers |
||||||
|
UBC 811 |
3 |
3 |
100 |
0,42 |
0,33 |
0,12 |
|
UBC 825 |
4 |
4 |
100 |
0,95 |
0,41 |
0,18 |
|
UBC 864 |
5 |
4 |
80 |
0,54 |
0,37 |
0,09 |
|
ACTG 4 |
6 |
5 |
83,3 |
0,63 |
0,39 |
0,11 |
|
UBC 855 |
7 |
6 |
85,7 |
0,57 |
0,22 |
0,16 |
|
Total |
44 |
38 |
86,3 |
0,63 |
0,45 |
0,13 |
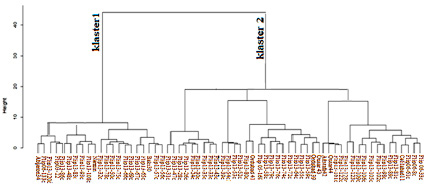
Fig. 4. Grouping of chickpea samples according to resistance to Fusarium disease as a result of RAPD and ISSR markers analysis
For comparison, let’s note that in the previous research study, 77 points of which 76 were polymorphic with RAPD primer and 41 points of which 32 were polymorphic with ISSR marker were recorded in 62 pea genotypes [9].
Among the studied genotypes in this study, 86.3% polymorphism was recorded, which is higher than the value noted in previous studies [12]. However, the dendrogram based on the Nei similarity coefficient was only able to distinguish resistant and susceptible genotypes. Moderately resistant genotypes were grouped in separate clusters. Resistant genotypes are grouped in the first cluster. Sensitive genotypes are located in cluster II (Figure 4).
Thus, these primers, which were associated with susceptibility by other researchers, were also associated with susceptibility in our study. Among the studied genotypes in this study, polymorphism was recorded, resistant and susceptible genotypes were identified. However, in the dendrogram obtained as a result of the cluster analysis based on the Nei similarity coefficient, the genotypes were grouped into two main clusters, the first cluster contained susceptible and highly susceptible (22 samples), and the second cluster contained resistant and highly resistant genotypes (43 samples) (Figure 4).
Conclusion
Flip 13-123, Flip 13-28, Flip 13-109, Flip 13-75, Flip 13-79c, Flip 13-80c, Flip 13-161, Flip 13-52, Flip 13-33, Flip 13-35, Genotypes Flip 13-47, Flip 13-54, Gusar 44, Jalilabad 11, Ordubad 39, Ordubad 41, Flip 13-102, Flip 13-105, Flip 13-106 according to the phytopathological assessment carried out in field conditions and the results of molecular analyzes were evaluated as fusarium resistant samples. The information we obtained as a result of the research can be effectively used in the cultivation of disease-resistant chickpea samples.
Библиографическая ссылка
Гасанова С.К., Маммадова А.Д., Алийев Р.Т. STUDY OF CHICKPEA GENOTYPES (CICER ARIETINUM L.) RESISTANCE TO FUSARIUM DISEASE WITH DNA MARKERS // European Journal of Natural History. 2023. № 6. ;URL: https://world-science.ru/en/article/view?id=34368 (дата обращения: 21.06.2026).
DOI: https://doi.org/10.17513/ejnh.34368