
Scientific journal
European Journal of Natural History
ISSN 2073-4972
ИФ РИНЦ = 0.204
ANALYSIS OF THE EFFECTIVENESS OF THE IMPLEMENTATION OF AUTOMATED QUALITY CONTROL SYSTEMS FOR SHOE PRODUCTS USING MOBILE APPLICATIONS

At the moment, there is an acute issue in the world to improve the quality and automation of production at shoe enterprises. Old technological maps for the manufacture of products according to outdated databases of materials, equipment, and product specifications are widely used. Manual indicators of accounting and quality control of manufactured goods prevail over automatic ones.
Today, information systems are used, on the basis of which it is possible to fully manage the production processes of the enterprise [1]. At the same time, it is necessary to take into account their imperfection and the need for constant refinement.
Many modern enterprises use imperfect methods of quality control of manufactured products. This is reflected in the high cost of human resources to perform routine operations manually. For example, there are still shoe enterprises, the accounting of manufactured products at which occurs by recounting by employees of the enterprise. Similarly, the number of products with defects is determined, which takes a lot of time and can lead to untimely detection of imperfect chains in production and leads to high production costs [2].
As you know, in the modern world, according to the quality management system, which is regulated by the ISO 9001 standard, one of the basic principles is customer orientation. This means only one thing – it is the buyer of the finished product who regulates the behavior and demand for the product. Customer demand for a particular product or service depends on many factors, but the main one is its qualitative components, which give the main competitive advantage. For this at present, most manufacturers of goods or services are trying their best to standardize their activities in order to improve the quality of products.
The main part of advanced industries have quality control departments of products, which can carry out their activities with loss of time and costs, which as a result can lead to untimely detection of defects in production lines and, as a result, this affects the qualitative and quantitative characteristics of the finished product. This trend continues in many shoe enterprises.
The developed software module, which is part of the proposed information system, is able to manage the quality of production processes through the introduction of automation of processes for processing initial data, which determine the level of quality of both intermediate and final results. This makes it possible to carry out timely monitoring of defects in manufactured products at each stage of its manufacture, as well as the introduction of modern planning technologies, for example: Ishikawa diagrams [3].
Describe the functional features of the developed information module and reveal the algorithms for the operation of statistical quality tools that are implemented in this program.
Mathematical and algorithmic justification for the development of a software statistical module
The development of the software module is based on statistical processing of input and production methods of quality control.
At the heart of the Pareto chart is the 80/20 rule, which states that eighty percent of marriage comes from twenty percent of sources.
The algorithm of the work plan of the statistical quality tool Pareto chart in the program module under consideration consists of several steps:
- initial data is collected for their subsequent processing;
- verification of the initial information, its belonging to the process under consideration;
- input data is confirmed and divided into several categories, depending on their type;
- the names of the horizontal and vertical axes are given;
- the width of the horizontal bars for plotting the chart is selected and the categories are named in descending order;
- on the vertical axis, numbers are deposited, the size of which slightly exceeds the rating of the highest category, deferred horizontally;
- the width of each column is calculated – categories, depending on the number of categories and the width of the working window of the application;
- panels of categories deferred along the vertical axis, relative to the horizontal axis, are created;
- Aggregate rows and calculations are added.
Pareto diagram – allows you to evaluate the deviations of the workflow as clearly as possible. Its disadvantage is that, unlike control charts, its use is not possible in real time.
Control charts are a statistical tool for quality monitoring, which is a graphical representation of the output information, thanks to which it is possible to visually track in real time the deviations from the established production process. Such a tool is especially useful for identifying regular or cyclical deviations that are not amenable to statistical controllability.
In the software module under consideration, Shewhart control cards X and R function as follows:
- the initial state is started and the control process is built;
- the observation period is determined;
- a control sample is harvested;
- the necessary measurements are carried out;
- the average value of the parameters is calculated. What is the following formula used for:
 (1)
(1)
where n – is the total number of parameters,
i – is the current index of the parameter,
Xn – parameter on the current iteration;
- calculation of the value of the average range:
 (2)
(2)
where n – is the total number of parameters,
i – is the current index of the parameter,
Ri – parameter on the current iteration;
- the completeness of the available data is established and whether additional tests for precision should be carried out;
- the correctness of calculations is checked;
- a check is carried out for violations of the control card;
- the evaluation of indicators is checked;
- indicators are evaluated;
- statistical attainability is checked;
- monitoring of possible violations of the assessment;
- measurements are completed according to the methodology;
- Settlement processes are finalized.
Control charts X and R are the most popular tool for statistical quality control, which is used by most of the leading industrial enterprises in various areas of activity, for this reason, the use of this algorithm in the current process of the software module is considered profitable.
A scatter plot is one of the powerful quality tools that allows you to determine the degree of dependence between different correlated input data in a visual way – using graphs.
It is often used in conjunction with the use of another quality tool – the Ishikawa Diagram, which will be discussed below.
In the considered software module, designed to automatically track the quality of production processes, the scatter diagram functions as follows:
- the initial state is started and the control process is formed;
- the time frame of observations is determined;
- preparatory procedures for the control sample are carried out;
- data is collected in pairs (that is, by x and y), between which it is necessary to check the correlation;
- the obtained data are sorted in ascending order;
- approximately equal scales of axes are selected for plotting the obtained values on them;
- a graph is built: points are applied, all the necessary designations of scales, points, etc.
- the correlation coefficient is calculated:
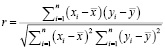 (3)
(3)
where yi , xi – are the input statistics,
x, y – average values of x, y,
n – collected input data pairs,
r – is the correlation coefficient;
- the probability of the correlation coefficient is calculated, that is, its average error:
 (4)
(4)
where r – is the correlation coefficient,
n – collected input data pairs,
Significance of the correlation coefficient:
- significant – if (r / mr) > 3, that is, the connection is proven,
- insignificant – if (r / mr) < 3, that is, the connection is not proven;
- the evaluation of indicators is checked;
- indicators are evaluated;
- statistical attainability is checked;
- the presence of potential violations committed during the assessment is checked;
- the process of measurements is completed;
- the calculation part is finalized.
The value of the correlation coefficient is used in the case of only a linear relationship of various quantities. Usually, the value of the correlation coefficient is in the range between –1 and +1. There are several types of correlation:
- communication is not possible when r is equal to 1;
- weak – when the value of rmodulo is less than 0.5;
- average – the value of rmodulo is in the range from 0.5 to 0.7;
- strong – the value of rmodulo is in the range from 0.7 to 1.
The scatter diagram allows you to identify patterns of manifestations of manufacturing defects, which makes it necessary to include it in the developed software module.
P-card – a control card of the proportion of defects is used in the case when there is a need to control the level of quality indicators determined by the proportion of defective products. This card is effective to use when the volume of samples under study is not stable. So, this takes into account the possibility of changing the upper limits. With the number of quality criteria equal to two, it is established to take into account the boundaries of statistical stability, here we mean 3 sigma, according to the binomial distribution. If this quantitative indicator of quality is equal to or more than three, then instead of distribution according to the binomial law, a polynomial one will be used.
Card-p of rejected products, which indicates the following:
- values of defective levels calculated;
- defect levels are average;
- control limit values.
P-maps are built in this developed software module as follows:
- the initial state and the control process are launched;
- a plan for the observation process is drawn up;
- a sample is determined for the implementation of control processes;
- the initial data are systematized for their subsequent processing as follows: products are divided into quality criteria and not, depending on the requirements of regulatory documents imposed on them. After that, the sample is divided into subgroups, in each of which defective products are determined in the amount from 1 to 5. In this case, it is possible as a result of the presence of from 20 to 25 such subgroups.
- the correctness of the initial information is checked, as well as its compliance with the process under study;
- the share of defective products in each of the selected segments is established, according to the formula:
 (5)
(5)
where Di – is the number of identified defective products in the i-th batch,
ni – the total number of units in the i-th batch;
- The following formula is used to determine the proportion of each i-th batch of defective products:
 (6)
(6)
where Di – is the number of products rejected in the i-th batch,
ni – the number of units from the i-th batch as a whole;
- the average level of indicators of looseness of products is calculated using the following formula:
 (7)
(7)
where Di – is the number of products rejected in the i-th batch,
ni – the number of units from the i-th batch as a whole;
k – is the total number of batches;
- the upper permissible control limit of the control card, calculated by the formula:
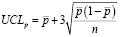 (8)
(8)
where n – is the total population of the subgroup,
p – the average rate of defective products from the studied batch;
- the lower permissible control limit of the control card, calculated by the formula:
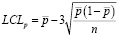 (9)
(9)
where n – is the total population of the subgroup,
p – the average rate of defective products from the studied batch;
Note: if its value is negative, the lower control limit of the control card is not calculated;
- The following formula is used to determine the average permissible control limit of the control card:
 (10)
(10)
where n – is the total population of the subgroup;
- control lines and all the results obtained are plotted on the control chart;
- indicators are evaluated;
- statistical attainability is checked;
- an assessment is carried out for violations;
- measurements are completed;
- the calculations are brought to their logical conclusion.
Control np-cards are used in qualitative control only under the condition that the sample subject to control has fixed dimensions.
Map-np of defective products is a graph on which the following are reflected:
- estimated levels of defects;
- average levels of defects;
- Regulatory boundaries.
When constructing a control np-map, the condition under which the upper bounds can be variable is taken into account. Taking into account the quantitative indicators of quality equal to two and when creating a control p-map, the boundaries of statistical stability, that is, 3 sigma, are subject to calculation according to the binomial distribution. With such a quantitative attribute of quality, it is equal to or greater than three – then, according to the binomial law, the polynomial is used instead of the distribution.
To build an np-map of the number of inconsistencies, the following is carried out in the program module:
- the initial process is started in parallel with the control functionality;
- the boundaries of observations are calculated;
- a sample is selected for the implementation of control measures;
- control indicators are taken and processed according to the following algorithm: in strict accordance with regulatory documents, products are determined as defective or not. After that, the sample is divided into subgroups, in each of which defective products are determined in the amount from 1 to 5. In this case, it is possible as a result of the presence of from 20 to 25 such subgroups.
- the correctness of the initial information is checked, as well as its compliance with the process under study;
- the average number of defective products in each of the selected segments is set, according to the formula:
 (11)
(11)
where D – is the total number of units in the subgroup,
k – is the total number of such subgroups;
- Next, the calculation of the upper permissible control limit of the control card is carried out, according to the following formula:
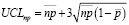 (12)
(12)
where np –is the average number of defective products,
p – an indicator of the average number of defective products from the batch;
- Next, the lower permissible control limit of the control card is calculated, according to the following formula:
 (13)
(13)
where np – is the average number of defective products,
p – an indicator of the average number of defective products from the batch;
Note: if its value is negative, the lower control limit of the control card is not calculated;
- Next, we calculate the average permissible control limit of the control card:
 (14)
(14)
where np – is the average number of defective products;
- control lines and data obtained are depicted on the control card;
- indicators are evaluated;
- statistical attainability is checked;
- monitoring is carried out to identify violations of the assessment;
- measurements are completed ;
- the calculations are brought to their logical conclusion.
The use of this software module allows you to raise the control system for the production of shoe products to a higher level and reduce the number of defects.
Control cards p and np, in contrast to the c-map, are used in the case when several inconsistencies may be present in the observed object at the same time.
The control u-card is used to track and control processes, taking as a basis a sample as a result of consideration of various defects, taking into account their quantitative and qualitative indicators.
These control charts according to the calculation and construction algorithm in the developed software module are very similar and represent the following form:
- the initial process is started in parallel with the control functionality;
- the boundaries of observations are calculated;
- a sample is selected for the implementation of control measures;
- control indicators are taken and processed according to the following algorithm: in strict accordance with regulatory documents, products are determined as defective or not. After that, the sample is divided into subgroups, in each of which defective products are determined in the amount from 1 to 5. In this case, it is possible as a result of the presence of from 20 to 25 such subgroups.
- the correctness of the initial information is checked, as well as its compliance with the process under study;
- the upper control limit is calculated;
- the lower control limit is calculated;
Note: calculations should not be carried out with a negative value of the lower control limit;
- the average control limit is calculated;
- control lines and data obtained are depicted on the control card;
- indicators are evaluated;
- statistical attainability is checked;
- monitoring is carried out to identify violations of the assessment;
- measurements are completed ;
- the calculations are brought to their logical conclusion.
The algorithms under consideration differ only in the methods for determining the control boundaries of regulation with the middle line and the average number of differences for the c-card with the algorithm for determining the average amount of non-compliance per unit of output for the u-card.
We find the average number of inconsistencies for the control c-card:
 (15)
(15)
where c – is the number of deviations from the norm in each subgroup,
k – is the number of subgroups under study;
We find the upper permissible limit of the control limit of the c-card:
 (16)
(16)
where c – is the average number of deviations from the norm in each subgroup.
We find the average permissible limit of the control c-card:
 (17)
(17)
where c – is the average number of deviations from the norm in the sample.
We find the lower permissible limit of the control c-card:
 (18)
(18)
where c – is the average number of deviations from the norm in the sample.
We find for the control u-card the average numerical indicator of deviation from compliance per unit of output:
 (19)
(19)
where D – is the total number of units under study in the subgroup under consideration,
k – is the total number of subgroups studied;
We find the upper permissible control limit of the c-card:
 (20)
(20)
where u – is the average number of products with identified deviations from the standard,
n – the average number of selected products.
We find the average permissible control limit of the c-card:
 (21)
(21)
where u – is the average number of products with identified deviations from the standard,
We find the average permissible control limit of the c-card:
 (22)
(22)
where u – is the average number of products with identified deviations from the standard,
n – the average number of selected products.
The Ishikawa diagram is a way of visualizing problems and the factors that influence their origin, connected by cause-and-effect relationships. Nowadays, this diagram has found application not only in the conditions of production processes and tracking their quality, but also in other problematic branches of science and knowledge.
Advantages of this quality tool:
- is a group assistant in highlighting the main problems of the process under study;
- is a good basis for analyzing problems through brainstorming and attacks;
- provides an opportunity to group the main problems and causes into separate groups;
- allows you to identify the most significant causes and discards false signs that arise along the way, providing an opportunity to focus on analysis and decision;
- in the general discussion of the identified problems, it creates the effect of collective intelligence;
- easy to learn and use.
In the proposed software product for constructing an Ishikawa diagram, the following algorithm of actions passes:
- the initial state is started and the algorithm of the control process is determined;
- the problem is defined and its consequences are stipulated;
- the obtained data is entered into the program;
- each reason is subjected to a more detailed analysis and if there are clarifications and additions, they are immediately entered into the program;
- verification is made for the completeness of the initial information under study and its compliance with the process under study;
- statements about the problem and its causes that are closest to reality are selected;
- a set of the most influential reasons for the occurrence of the analyzed problem is established;
- there is a check for the reliability of the most likely causes;
- indicators are evaluated;
- monitoring of potential deviations from the assessment methodology;
- the current analysis process is completed [3].
The functioning of the developed software module is based on statistical processing of input and production information of quality control. Figure shows an example of how a program for assessing shoe defects works.
Conclusion
The proposed software product is based on automatic analysis, taking into account the initial indicators at all stages of the production process. Its implementation will make it possible to carry out quality control in more detail at each production cycle, within the framework of which it is flexible to adjust and adjust at each stage of production.
These successes can be achieved through the use of statistical quality control methods, such as: Pareto and scatter diagrams in the developed software, Shewhart X and R control charts, the number and proportion of inconsistencies, diagrams.

An example of the program for assessing shoe defects
Production planning has become more efficient due to the inclusion of new software features, including the introduction of Ishikawa diagrams.
At the same time, the advantages include the possibility of introducing this software product into a larger information system, under the management of which the enterprise operates [4].
In the process of creating the source code of the software, some types of production were analyzed, namely shoe products at specialized enterprises [5,6,7]. On their basis, the following methods of statistical control of production cycles are identified for implementation in the proposed software product:
- control charts;
- Shewhart X and R;
- scatter diagram;
- Pareto chart;
- control charts of the number of discrepancies c and u;
- control charts of the number and proportion of mismatches p and np;
- Ishikawa diagram.
The proposed tools occupy a leading position in the analysis of production initial and final data, high-quality and comprehensive coverage of the production process. That, in turn, should allow the introduction of new methods of information processing, fine-tuning and avoiding deviations from production regulations.
Библиографическая ссылка
Обухов П.С., Крейнин В.С., Мануйлов И.В. ANALYSIS OF THE EFFECTIVENESS OF THE IMPLEMENTATION OF AUTOMATED QUALITY CONTROL SYSTEMS FOR SHOE PRODUCTS USING MOBILE APPLICATIONS // European Journal of Natural History. 2023. № 3. ;URL: https://world-science.ru/en/article/view?id=34346 (дата обращения: 26.07.2026).
DOI: https://doi.org/10.17513/ejnh.34346