Industrial equipment monitoring systems have many features that allow operators and engineers to monitor the condition of equipment. In modern manufacturing, data collection is a crucial step in optimizing production processes. Companies need to monitor their production processes in order to make quick and informed decisions. The hardware data acquisition module for an analytical system is an integral component that allows you to collect data and convert it into valuable analytical data.
Monitoring and analysis of production processes allows you not only to monitor the progress of work at the enterprise, but also to find problems [1, 2] and solve them before they become more serious problems, and also helps you understand which aspects of the process need improvement.
The purpose of the study
Analytical system for monitoring production processes is a hardware and software system, that analyzes production process data and helps management make the right decisions.
The system utilizes both hardware and software tools to capture and analyze production process data, providing valuable insights into the workings of the production line. By automating production monitoring, the analytical system helps maintain production efficiency and reduce downtime.
The analytical system can be divided into two main subsystems: the data collection and storage subsystem and the data analysis subsystem. The data collection and storage subsystem are responsible for capturing and storing production data. This subsystem incorporates a hardware data acquisition module, which is used to gather data from machines in real-time. The data is then stored in a database management system.
The second subsystem, the data analysis subsystem, is responsible for analyzing the data to identify trends and patterns that can help optimize the production process. To achieve this, high-performance data analysis algorithms are developed and optimized to analyze the collected data. The purpose of the study is to implement a hardware data acquisition module. Also, for further development of the system, it is necessary to collect and systematize a set of data on the operation of machinery.
Module Characteristics
The main functions involve talking machine load indicators, algorithmically selecting the machine state based on the collected indicators, and sending all the received data to the server.
To solve the problem of installing the system on various industrial equipment, it was decided to use a transformer sensor. It works based on the principle of electromagnetic induction, where the magnetic field generated by the electric current flowing in a conductor induces a current in a secondary winding of the transformer.
The equipment load indicator is measured by measuring the magnetic field caused by alternating current in the power cables with the sensor. The measurements are made independently for each phase of the power supply. The measured parameters are converted to digital format.
The data acquisition subsystem reads data from the phases every 5 seconds. Then, relative to the sum of the readings from the three power supply phases, the machine state is selected.

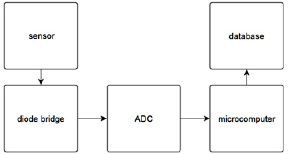
Fig. 1. Block diagram of the sensor operation
Based on the collected data, a request is made to the server in the database. The request uses a text format for data exchange of the json type. The block diagram of the hardware module operation is shown in Figure 1.
Selecting components
The selection of components for the hardware module is essential in ensuring accurate and reliable data collection. Careful selection must be taken to source high-quality materials and components from reputable manufacturers. It is also vital to select components that can withstand harsh industrial settings and environments.
The following components were selected to implement the module:
A SCT-013-000 YHDC sensor is used to take current consumption readings. The sensor consists of a black plastic shell and two wires. Inside the shell there is a transformer that measures the current passing through the wire to which the sensor is connected. During operation, the current through the primary winding of the transformer induces a magnetic field, which causes a voltage to appear on the secondary winding. This voltage is then used to measure the current using an external measuring device. It has a measurement range from 0 to 100 A with a measurement period of 50 Hz/60 Hz.
To convert an alternating signal from transformer sensors, it was decided to use diode bridges on Schottky diodes with a frequency filter. All components for low-power current.
For the controller part of the module, it was decided to use the Orange Pi Zero microcomputer. Orange Pi Zero is a single-board computer[3, 4] based on the Allwinner H2+ processor with 4 ARM Cortex-A7 cores and a frequency of up to 1.2 GHz. Advantage in computing power, Linux-based OS [5], built-in Ethernet port, GPIO support. There is a disadvantage in the absence of analog ports
The problem with the lack of analog ports is solved by installing the ADS1115 ADC. The board has four analog ports, an I2C bus, a 16-bit resolution, and a maximum conversion rate of 860 samples per second.
A compact modular MK-1230 5V 2A power supply is selected for powering the module.
Transmitting data
Data transmission is a necessary component of modern information technologies. In our case, data transmission is carried out via local networks [6]. To exchange information between subsystems, the HTTP protocol is used, which defines standards for data transmission over the Internet.
When transferring data between subsystems, HTTP requests are used for a specific URL to which the necessary data is connected [7].
Data type
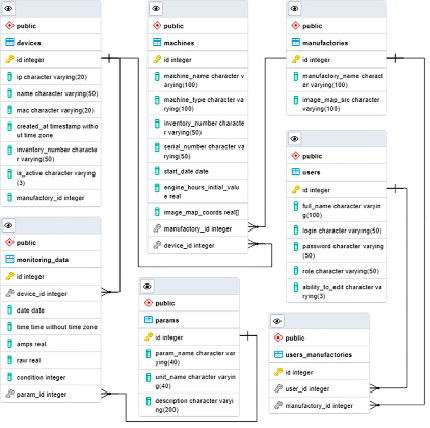
The type of data collected will be critical in determining the completeness of the hardware module. To store and organize data, create tables in the DBMS (Figure 2):
− Users. List of shop floor employees and administrators.
− Machines. List of all machine tools in the company.
− Devices. List of active and decommissioned sensors.
− Manufactories. List цехов of the company's workshops.
− Users_manufactories. Defines the allowed workshops for the user.
− Params. A list with a description of the data received from the sensor.
− Monitoring_data. List of machine tool monitoring data.

Fig. 2. Table interaction diagram and data structure
The configuration file for the software of the hardware module of the data acquisition subsystem is located in the same directory as the program script.
The setupfile stores data such as:
− ip address of the server subsystem.
− Device id.
− Parameters of current consumption limits. Depending on the set limits, the state of the machine is selected.
− Coefficients k1 and k2 for the formula for calculating values using the least squares method;
− Serial iddevice IDs.
Recording data
Recording data is a crucial aspect of any data-driven system. In order to capture, store, and utilize valuable information, a reliable and efficient storage solution is required. The PostgreSQL database management system (DBMS) is an ideal solution for this purpose, offering a robust and scalable platform for storing and managing data.
With PostgreSQL, users have the ability to store, edit, and organize data with ease, thanks to its flexible data model and powerful data manipulation capabilities. The system is designed to handle large volumes of data and can be used for a wide range of applications, from small-scale data collection to enterprise-level solutions.
When interacting with the PostgreSQL subsystem, users leverage the structured query language (SQL) to write commands and queries that manipulate the data stored in the database.

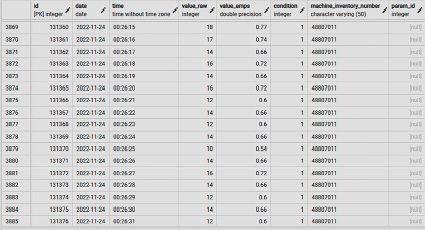
Fig. 3. Structured records in the database
SQL is a powerful and widely-used language that allows users to retrieve, update, and delete data, as well as create and modify database structures.
Overall, the combination of PostgreSQL and SQL provides a powerful and flexible solution for recording and managing data. With these tools, users can efficiently capture and store important information, ensuring that critical insights are readily available and easily accessible for analysis and decision-making.
Test on industrial equipment
After assembling the hardware module, we install it on a Haas MiniMill industrial milling machine. We check whether messages can be sent to the server, then run the data collection script and check the database (Figure 3).
During the testing process, we also monitor the performance of the hardware module using specialized software tools, ensuring that it meets the necessary technical specifications for reliable and accurate data collection. Additionally, we run stress tests on the industrial equipment to validate the hardware module's robustness and resilience in challenging operating environments. Finally, we thoroughly document the testing and validation results, providing clear and concise reports for future reference and troubleshooting purposes. By following these rigorous testing and validation procedures, we ensure of a high-quality, reliable, and cost-effective hardware module that meets the needs.
Conclusion
At this stage, a data collection subsystem has been successfully implemented, which includes a hardware data collection module and a data transmission algorithm. This means that we can capture the data generated by the production equipment and transfer it to the server for further processing.
The module was tested on the machine and we made sure that it works correctly and reliably, collecting all the necessary data. This step is extremely important because the reliability and accuracy of data collection is very important for subsequent analytics.
A data storage system was also chosen, namely the PostgreSQL database. It is a powerful and flexible system that can handle large amounts of data.
Specialized analytical software tools will be used to interpret and extract valuable insights from the collected data. The data will be analyzed to identify patterns, trends, and anomalies in the production process, providing operators with valuable information about the performance of individual machines and the overall efficiency of the production line.
To ensure the accuracy and reliability of the analytical results, it will be necessary to develop and fine-tune algorithms that are customized to the specific production environment and system requirements. These algorithms will leverage sophisticated statistical and mathematical models to analyze the data and provide operators with actionable insights and recommendations for optimizing the production process.
The ultimate goal of this stage is to develop a comprehensive analytical system that can provide real-time monitoring and analysis of production processes, enabling operators to proactively identify and resolve issues before they become major problems. With this system in place, production efficiency can be maximized, downtime can be minimized, and overall profitability can be improved, ensuring the continued success of the product

