
Scientific journal
European Journal of Natural History
ISSN 2073-4972
ИФ РИНЦ = 0.204
RESULTS OF STUDIES OF DAIRY PRODUCTS BY THE METHOD OF WEIGHT IMPEDANCE ELECTROMETRY WITH A CAPACITIVE SENSOR

According to a study conducted by the Research Financial Institute of the Ministry of Finance, every second pack of butter, a fourth bottle of milk and every fifth ice cream are counterfeit. In percentage terms, the share of illegal circulation of drinking milk and cream reaches 24.56%, butter and ghee, as well as spreads – 44.13%, ice cream – 21.51%. Given these statistics, we can safely say that the problem of counterfeit products on store shelves is relevant. Therefore, it is necessary to develop a new method for controlling the quality of dairy products [1].
The purpose of this research is to study dairy products by the method of weight impedance electrometry with a capacitive sensor, as well as to obtain data for their further use.
Materials and methods of research
For this study, cream of 10%, 20% and 33% fat content, a capacitive sensor, scales with an accuracy of one hundredth of a gram, a temperature sensor, and an E7-20 immitance meter were used. All experiments were carried out at an air temperature of 22°C and a temperature product at 21°C. The volume of the test product is 50 ml with an error of no more than 0.4 ml.
The presented E7-20 immitance meter (Fig. 1) is a precision device of accuracy class 0.1 with a wide operating frequency range of 25 Hz – 1 MHz and a high measurement rate of up to 25 per second. Measured parameters E7-20: inductance, capacitance, resistance, conductivity, loss factor, quality factor, complex resistance modulus, reactance, phase shift angle; leakage current. various physical quantities [2].
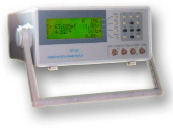
Fig. 1. E7-20 immittance meter
Measurements using an “inserted” dual coaxial sensor of two capacities (Cos, Cis) and two loss angle tangents (tgδos, tgδis) make it possible to calculate the average value of the relative permittivity (ε) of milk, and in the presence of standard data (τе, ηе), – to determine the dynamic viscosity of the sample (ηо), by calculating its microscopic (τо) and macroscopic relaxation times (τ) [3-5]:
ε = Сmeasured / C0 , (1)
η0 = (τ0ηe) / τe , (2)
τ0 = 3ετ0 / (2ε + 1), (3)
tgδ = (ε – ε∞)ωφ / (ε+ ω2τ2), (4)
where C0 is the capacitance of the sensor in air; С measured is the capacitance of the sensor in the medium being measured; η0 – dynamic viscosity; τ and τ0 are the macroscopic and microscopic relaxation times; ω is the cyclic frequency; ηе and τе are tabular air data loaded into the computer.
A capacitive sensor is a parametric type converter in which a change in the measured value is converted into a change in the capacitance of a capacitor. The main element of capacitive sensors is a capacitor, which can be made in a flat or cylindrical form. When the movable plate of the capacitor begins to move, increasing the distance to the fixed plate, the dielectric is deformed, and its position changes, leading to a change in the permittivity and many other parameters [6], The capacitance for a flat capacitor is calculated using the following formula:
C = (ε × ε0 × S) / d , (5)
where ε is a constant value relative to the permittivity of the medium between the plates; S is the plate area; d is the distance between the plates.
The density of cream depends on two factors, these are temperature and percentage of fat content. The higher the temperature, the lower the density. To determine the density, the formula is used:
ρ = m / V, (6)
where m is the mass of the product, V is the volume.
In terms of density, depending on the mass fraction of fat, cream must meet the requirements set forth in Table 1.
Table 2 below shows average measurements of 10% fat cream on a capacitive sensor for frequencies from 100 to 1,000,000 Hz.
Following the data obtained from the table, graphs of conductivity and complex resistance (Fig. 2) were plotted in the range of measured frequencies.
Table 1
Density depending on the mass fraction of fat
|
mass fraction of fat, % |
density at 20°С, kg/m3 |
|
9.0 to 20.0 |
1020.0 to 1008.0 |
|
20.0 to 30.0 |
1008.0 to 997.0 |
|
30.0 to 40.0 |
997.0 to 987.0 |
|
40.0 to 50.0 |
987.0 to 976.0 |
|
50.0 to 58.0 |
976.0 to 968.0 |
According to the above formula (1), we calculate the permittivity at the studied frequencies and plot the dielectric permittivity graph (Fig. 3).
Knowing the volume and mass, we find the density using the formula (6):
ρ = m / V = 0.05041 / 0.00005 = 1008.2 kg/m3
The result obtained corresponds to the value indicated in table 1.
Table 3 shows the results of measurements of 20% fat cream on a capacitive sensor for frequencies from 100 to 1,000,000 Hz.
We will also build graphs of conductivity, permittivity and complex resistance (Fig. 4) in the range of measured frequencies.
Let’s calculate the density:
ρ = m / V = 0.04993 / 0.00005 = 998.6 kg/m3
Table 4 below shows average measurements of 33% fat cream on a capacitive sensor for frequencies from 100 to 1,000,000 Hz.
Table 2
Average value of parameters for cream 10%
|
Frequency average |
||||||||||
|
Frequency (Hz) |
Ср (pF) |
L (H) |
Rp (Ω) |
1/Rp (nS) |
Gp (nS) |
Q |
j (°) |
|Z| |
tgδ (D) |
I(mA) DC |
|
Instruction manual code |
0 |
1 |
2 |
x |
3 |
6 |
10 |
12 |
13 |
14 |
|
100 |
4E-05 |
-0,07 |
44,47 |
0,0225 |
0,0225 |
1,07 |
-47,1 |
30,5 |
0,931 |
1E-05 |
|
200 |
3E-05 |
-0,02 |
32,25 |
0,031 |
0,031 |
1,08 |
-47,3 |
22 |
0,9241 |
|
|
500 |
2E-05 |
-0,01 |
19,87 |
0,0503 |
0,0503 |
1,04 |
-46,3 |
13,8 |
0,9595 |
|
|
1000 |
1E-05 |
-0 |
13,1 |
0,0763 |
0,0763 |
0,93 |
-43 |
9,63 |
1,0753 |
|
|
2000 |
7E-06 |
-0 |
8,69 |
0,115 |
0,11506 |
0,76 |
-37,2 |
6,93 |
1,3229 |
|
|
5000 |
3E-06 |
-0 |
5,53 |
0,1808 |
0,18083 |
0,51 |
-27,2 |
4,92 |
1,9538 |
|
|
10000 |
1E-06 |
-0 |
4,37 |
0,2288 |
0,22883 |
0,35 |
-19,5 |
4,12 |
2,8394 |
|
|
20000 |
5E-07 |
-0 |
3,753 |
0,2664 |
0,26643 |
0,22 |
-12,6 |
3,67 |
4,4957 |
|
|
50000 |
9E-08 |
-0 |
3,43 |
0,2915 |
0,29154 |
0,1 |
-5,56 |
3,41 |
10,35 |
|
|
100000 |
7E-09 |
-0 |
3,29 |
0,3039 |
0,30395 |
0,01 |
-0,88 |
3,29 |
68,388 |
|
|
200000 |
-2E-08 |
3E-05 |
3,235 |
0,3091 |
0,30912 |
0,09 |
5,43 |
3,22 |
10,426 |
|
|
500000 |
-3E-08 |
3E-06 |
3,6283 |
0,2756 |
0,2756 |
0,35 |
19,51 |
3,42 |
2,8169 |
|
|
1000000 |
-3E-08 |
1E-06 |
4,035 |
0,2478 |
0,24783 |
0,64 |
32,72 |
3,39 |
0,7406 |
|
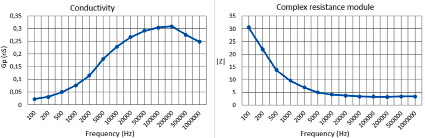
Fig. 2. Graphs of conductivity and the modulus of complex resistance
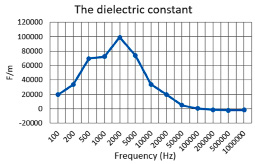
Fig. 3. Graph of dielectric constant
Table 3
Average value of parameters for cream 20%
|
Frequency average |
||||||||||
|
Frequency (Hz) |
Ср (pF) |
L (H) |
Rp (Ω) |
1/Rp (nS) |
Gp (nS) |
Q |
j (°) |
|Z| |
tgδ (D) |
I (mA) DC |
|
Instruction manual code |
0 |
1 |
2 |
x |
3 |
6 |
10 |
12 |
13 |
14 |
|
100 |
4E-05 |
-0,06 |
42,51 |
0,02352 |
0,02352 |
1,121 |
-48,2 |
28,438 |
0,89045 |
7E-06 |
|
200 |
3E-05 |
-0,02 |
29,722 |
0,03365 |
0,03365 |
1,083 |
-47,3 |
20,22 |
0,92576 |
|
|
500 |
2E-05 |
-0,006 |
17,56 |
0,05695 |
0,05695 |
0,951 |
-43,6 |
12,73 |
1,05226 |
|
|
1000 |
1E-05 |
-0,002 |
11,6 |
0,0862 |
0,0862 |
0,783 |
-38,1 |
9,171 |
1,27775 |
|
|
2000 |
6E-06 |
-0,001 |
8,092 |
0,12358 |
0,12358 |
0,594 |
-30,8 |
6,96 |
1,68225 |
|
|
5000 |
2E-06 |
-5E-04 |
5,74 |
0,17422 |
0,17422 |
0,377 |
-20,7 |
5,37 |
2,65485 |
|
|
10000 |
8E-07 |
-3E-04 |
4,9 |
0,20408 |
0,20408 |
0,25 |
-14,1 |
4,76 |
4,0081 |
|
|
20000 |
3E-07 |
-2E-04 |
4,46 |
0,22422 |
0,22422 |
0,153 |
-8,71 |
4,41 |
6,55855 |
|
|
50000 |
5E-08 |
-2E-04 |
4,22 |
0,23697 |
0,23697 |
0,062 |
-3,54 |
4,22 |
16,27167 |
|
|
100000 |
-6E-10 |
0,004 |
4,12 |
0,242719 |
0,242718 |
0,0014 |
0,08 |
4,12 |
435,422 |
|
|
200000 |
-1E-08 |
4E-05 |
4,09 |
0,244499 |
0,244499 |
0,0875 |
4,99 |
4,07 |
6,22375 |
|
|
500000 |
-2E-08 |
5E-06 |
4,41 |
0,22676 |
0,22676 |
0,287 |
15,99 |
4,24 |
1,47812 |
|
|
1000000 |
-2E-08 |
1E-06 |
4,62 |
0,21645 |
0,21645 |
0,519 |
27,4 |
4,1 |
1,92847 |
|
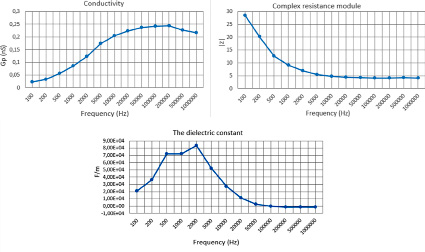
Fig. 4. Graphs of conductivity, modulus of complex resistance and permittivity
Table 4
Average value of parameters for cream 33%
|
Frequency average |
||||||||||
|
Frequency (Hz) |
Ср (pF) |
L (H) |
Rp (Ω) |
1/Rp (nS) |
Gp (nS) |
Q |
j (°) |
|Z| |
tgδ (D) |
I (mA) DC |
|
Instruction manual code |
0 |
1 |
2 |
x |
3 |
6 |
10 |
12 |
13 |
14 |
|
100 |
4E-05 |
-0,058 |
39,178 |
0,026 |
0,0255 |
1,07 |
-46,88 |
27 |
0,9 |
1,2E-05 |
|
200 |
3E-05 |
-0,022 |
26,625 |
0,038 |
0,0376 |
0,97 |
-44,11 |
19 |
1 |
|
|
500 |
2E-05 |
-0,007 |
15,9 |
0,063 |
0,0629 |
0,77 |
-37,77 |
13 |
1,3 |
|
|
1000 |
9E-06 |
-0,003 |
11,1 |
0,09 |
0,0901 |
0,6 |
-30,97 |
9,6 |
1,7 |
|
|
2000 |
4E-06 |
-0,002 |
8,51 |
0,118 |
0,1175 |
0,43 |
-23,52 |
7,8 |
2,3 |
|
|
5000 |
1E-06 |
-8E-04 |
6,76 |
0,148 |
0,1479 |
0,26 |
-14,86 |
6,5 |
3,8 |
|
|
10000 |
4E-07 |
-6E-04 |
6,13 |
0,163 |
0,1631 |
0,17 |
-9,812 |
6 |
5,8 |
|
|
20000 |
1E-07 |
-4E-04 |
5,77 |
0,173 |
0,1733 |
0,11 |
-6,038 |
5,7 |
9,5 |
|
|
50000 |
2E-08 |
-4E-04 |
5,58 |
0,179 |
0,1792 |
0,04 |
-2,443 |
5,6 |
24 |
|
|
100000 |
-5E-10 |
0,004 |
5,485 |
0,182 |
0,1823 |
0 |
0,093 |
5,5 |
485 |
|
|
200000 |
-9E-09 |
7E-05 |
5,447 |
0,184 |
0,1836 |
0,06 |
3,59 |
5,4 |
16 |
|
|
500000 |
-1E-08 |
9E-06 |
5,66 |
0,177 |
0,1767 |
0,2 |
11,467 |
5,5 |
3,6 |
|
|
1000000 |
-1E-08 |
2E-06 |
5,57 |
0,18 |
0,1795 |
0,36 |
19,7 |
5,2 |
1,7 |
|
Based on the data from Table 4, we plot conductivity, permittivity and complex resistance (Fig. 5) in the range of measured frequencies.
Let’s calculate the density:
ρ = m / V = 0.04952 / 0.00005 = 900.4 kg/m3
Results of the research and discussions
As can be seen from the above graphs, the impedance modulus with increasing fat content has a lower coefficient at low frequencies.
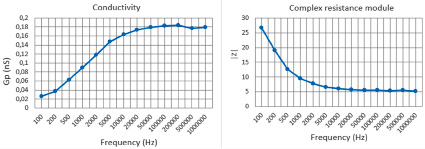
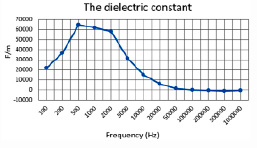
Fig. 5. Graphs of conductivity, modulus of complex resistance and permittivity
But at high frequencies, the coefficient increases with increasing fat content of the product. Regardless of the content of milk fat in the product, the graph does not have bursts and decays exponentially.
The conductivity for 10% and 20% cream increases steadily with increasing frequency and reaches its maximum at about 200,000 Hz, but after that there is a sharp decrease in this characteristic. Cream with 33% fat also reaches a maximum at 200,000 Hz, but this is followed by a slight decrease and increase in characteristic. It can also be seen that with an increase in the fat content of the product, its conductivity decreases.
The dielectric constant for 10% and 20% cream slows down at frequencies from 500 Hz to 1000 Hz, but then there is a sharp increase to a maximum value at 2000 Hz. After this frequency, an exponential decay is observed. For cream with a fat content of 33%, the extremum value is observed at 500 Hz, then a linear decrease in the dielectric constant follows, and after 2000 Hz an exponential decay is observed. There is also a decrease in the maximum dielectric constant with an increase in the fat content of the product.
Density indicators correspond to tabular values, which gives the right to consider this product to be of high quality.
Conclusion
In the course of a series of experiments, the dependences of the conductivity, dielectric constant and complex resistance were established for various indicators of the fat content of the dairy product. The dependence of the density of the product on the content of milk fat in it was also established and a comparison was made with reference values.
Библиографическая ссылка
Андреев В.В. RESULTS OF STUDIES OF DAIRY PRODUCTS BY THE METHOD OF WEIGHT IMPEDANCE ELECTROMETRY WITH A CAPACITIVE SENSOR // European Journal of Natural History. 2023. № 1. ;URL: https://world-science.ru/en/article/view?id=34309 (дата обращения: 28.07.2026).