
Scientific journal
European Journal of Natural History
ISSN 2073-4972
ИФ РИНЦ = 0.204
ABOUT METHODS OF CONTROL OF PARAMETERS IN THE FILLING AND SALES OF DAIRY PRODUCTS.

According to a study conducted by the Research Financial Institute of the Ministry of Finance, every second pack of butter, a fourth bottle of milk and every fifth ice cream are counterfeit. In percentage terms, the share of illegal circulation of drinking milk and cream reaches 24.56%, butter and ghee, as well as spreads – 44.13%, ice cream – 21.51%. Given these statistics, it can be argued that the problem of identifying counterfeit and low-quality / expired dairy products on store shelves is relevant [1].
Therefore, the purpose of this study was to review the existing methods for identifying dairy products, as well as to develop a model for an express control system for the identification and quality of liquid packaged dairy products.
Material and research methods
In order to establish the facts that there is a falsification or non-compliance of liquid packaged dairy products with standards or specifications, studies should be carried out on changes in the following indicators that identify counterfeit or non-quality products:
- content in the finished dairy product or dairy composite product of milk solids (dry milk residue – SOMO), their mass fraction in the finished product as a percentage (with the exception of dairy products containing butter);
- the presence and content of fats of non-dairy origin, their mass fraction in milk and dairy products in percent;
- fatty acid composition of the fatty phase of milk and dairy products (with the exception of dairy products, the mass fraction of fat in which is less than 1.5% and ice cream, the mass fraction of fat in which is not more than 8%);
- the amount of protein in the dry fat-free milk residue in canned milk and milk-containing canned food, its mass fraction in percent;
- the ratio of whey proteins and casein in canned milk and milk-containing canned food.
The most suitable and most commonly used methods are organoleptic and physico-chemical. The general organoleptic indicators include appearance, texture, taste and smell, and the general physicochemical parameters include the determination of fat content, acidity, density, moisture and dry matter [2].
The organoleptic method is one of the main methods for determining the quality of milk. The assessment of the smell and taste of milk is carried out by a commission consisting of at least three selected testers or experts, specially trained and certified. Organoleptic assessment is carried out in special rooms. The air temperature and relative humidity in the premises should be maintained respectively (20±2)°С and (60±20)%. The final result of the test is the arithmetic mean of the marks awarded by the experts, rounded to the nearest whole number [3].
To determine the density of milk, the hydrometric method is mainly used. The cylinder with the analyzed sample is installed on a flat horizontal surface and the temperature of the sample is measured. The reading of the temperature readings is carried out no earlier than 2-4 minutes after the thermometer is lowered into the sample. The first reading of the density readings on the hydrometer scale is carried out 3 minutes after it is established in a stationary position. After that, the hydrometer is carefully raised to the height of the ballast level in it and lowered again, leaving it in a free floating state. After establishing it in a stationary state, a second reading of the density readings is carried out. The operator’s eyes should be at the level of the meniscus when reading the density reading. The readings are taken along the upper edge of the meniscus. If there are disagreements on the results of determining the density, a second determination is carried out [4].
These identification methods are quite simple, but have significant drawbacks:
firstly, the need to withdraw in a certain way (by random sampling) the goods from the batch, opening its packaging and sampling,
secondly, compliance with special identification conditions,
thirdly, the use of special equipment and reagents,
fourthly, measurement errors.
To solve the problem and optimize the control process, a model of a mobile automated complex was developed based on the use of the method of weight impedance electrometry [5].
The determination of the required parameters is carried out using the E7-25 immitance meter (Fig. 1) – a precision device of accuracy class 0.1 with a wide operating frequency range of 25 Hz – 1 MHz and a high measurement speed of up to 25 measurements / sec., thanks to the use of microprocessors. Measured parameters: inductance, capacitance, resistance, conductivity, loss factor, quality factor, complex resistance modulus, reactance, phase angle, leakage current (on direct current) [5].

Fig. 1. E7-25 emittance meter
As follows from the method of weight electrometry, measurements of two capacities and two loss tangents make it possible to calculate the average value of the relative permittivity of dairy products, and, if there are standard data, to determine the dynamic viscosity of a milk sample by calculating its microscopic and macroscopic relaxation times [6].
To obtain data from the emittance meter, it is necessary to embed a capacitive sensor in the lid of the container and bring the contacts out. The data and physical parameters of the packaged dairy products determined with the help of the meter will allow to identify the product with high accuracy by comparing the obtained values with the reference ones.
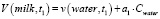
To carry out the verification of measurements, you can use the ultrasonic meter for the concentration of solutions “ULIKOR”. This device uses an ultrasonic (US) identification method based on measuring the propagation velocities of ultrasonic vibrations depending on the mass fractions of a substance (alcohol, fat, dry skimmed milk residue, etc.) in the test liquid, determined at sample temperatures t1 and t2, which (on the example of milk) are interconnected by the following relationships:
 (1)
(1)
 (2)
(2)
where V and v are the speeds of ultrasound in milk and water; Cfat, Csomo – mass fractions of fat and SOMO in a dairy product; ai and bi are coefficients; ti are measurement temperatures.
Thus, by measuring the speed of ultrasonic propagation in the same milk sample at temperatures t1 and t2 and solving the system of equations for Cf and Csomo, data on the mass fraction of the components are obtained. The rate of propagation of US in milk is determined by a number of factors, the values recommended in the literature are t1 = 41°C and t2 = 65°C [7].
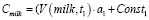
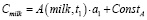
The dependence of the ultrasonic speed on the concentration of a substance is different and is extremely sensitive to the frequency used, the temperature and the properties of the object. If we confine ourselves to considering only aqueous solutions (emulsions) of organic and inorganic substances, in general, at a certain frequency and temperature, then such a dependence from zero to a certain concentration, as a rule, has a linear section, after which it becomes nonlinear. This is to be expected, taking into account that the ultrasonic speed theoretically depends not on the concentration of substances, but on their molarity, and additionally on the adiabatic compressibility, which a priori cannot be constant over the entire range of concentrations. With this in mind, we can represent the formula for calculating the concentration in the following form:
 (3)
(3)
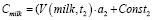
To determine the concentration, it is sufficient to set the coefficient “a” during calibration, and if the dependence is linear, then assuming that the speed of propagation of ultrasound in water at a given temperature is constant, we can use equation (4):
 (4)
(4)
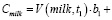
A similar relationship can be calculated for any other temperature:
 (5)
(5)
It is necessary to take into account the second and subsequent equations when calculating the final concentration, and it is desirable to create a general calibration dependence, according to which the concentration will be calculated according to formula (6):
 (6)
(6)
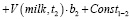
Such a graduation is more stable, because two (or several) equivalent members mutually compensate for possible changes in the external and internal conditions of a single measurement. The parameters measured in the process of measuring the characteristics of ultrasound consist not only of the speed of propagation of ultrasound, but of a number of others (for example, attenuation of ultrasound), moreover, some of them are not directly related to ultrasound (for example, heat capacity). When using the attenuation of ultrasound expressed in terms of the signal amplitude (A), the equation for calculating the concentration can be as follows:
 (7)
(7)
The combination of formulas (4.7) makes it possible to solve a system of equations of type 1-2 for two components in the sample, even if their ultrasonic velocity characteristics are close, but the ultrasonic damping characteristics are sharply different [7].
Returning to the analysis of the calibration dependences of substances in a wide range of concentrations, the following points should be noted:
firstly, in the general case, the accuracy in determining the quantitative content of a macrocomponent increases with an increase in its relative concentration, and vice versa, with a decrease in the relative concentration, the accuracy decreases;
secondly, this implies the need to always distinguish between the relative and absolute accuracy (error) of the analysis, understand their relationship and be able to use and apply depending on the circumstances.
For illustration, we present a conditional graph (Fig. 2) of the accuracy of the simultaneous determination of fat and protein (0-12%) in cream, depending on the increase in their fat content (0-60%) [8].
As can be seen from the graph, the conditional accuracy of protein determination up to a certain fat content indicated in blue will have a certain plateau (depending on the method used) and further decrease with its increase. This process is explained by the fact that in high-fat cream the amount of protein becomes minor in relation to fat, this effect can be conditionally called the influence of the matrix. In the general case, the method used after a certain percentage of fat content ceases to give reliable results [8].
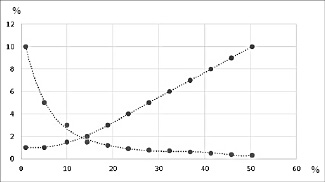
Fig. 2. Graph of relative accuracy
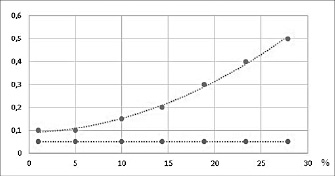
Fig. 3. Graph of absolute accuracy
A similar graph (Fig. 3), reflecting changes in absolute accuracy, is presented below. It can be seen that in the transition from skimmed milk to cream with a fat content of up to 30%, the protein concentration remains in a conditionally narrow range (4–2 wt%), and therefore a single value of the absolute error can be applied [8].
With a further increase in fat content and a corresponding decrease in protein content, all the rules for changing accuracy, described above, begin to affect. Everything said about accuracy in the fat/protein system can be applied to other more or less complex systems. But for each such system, the accuracy characteristics are individual and must be determined experimentally [8].
Research results and discussion
To obtain data from the imminence meter, it is necessary to embed a capacitive sensor in the lid of the container and bring the contacts out. The data and physical parameters of the packaged dairy product determined using the meter will allow you to identify the product with high accuracy by comparing the obtained values with the reference ones.
The method of express control of milk and dairy products by the ultrasonic method involves measuring the mass fraction of fat, the mass fraction of protein, the mass fraction of dry skimmed milk residue (SOMO) in milk, cream and ice cream, as well as the density of milk by the ultrasonic method. The methodology applies to harvested raw, whole, normalized milk, heat-treated milk, normalized, reconstituted, dry, canned, skimmed and concentrated milk.
Due to the verification of the results of the study of samples by ultrasonic (ULIKOR) and radio frequency (LQtest) methods, it becomes possible to develop a model of a system for continuous output control of packaged dairy products at the manufacturer (stationary automated complex) and its continuous input control at points of sale, which will 100% eliminate the implementation of counterfeit and poor quality products.
Conclusions
Methods for identifying milk and dairy products were considered. Also, examples of identification methods were given that can recognize a counterfeit without opening the container. A method based on weight impedance electrometry and the principle of its operation, as well as methods of radio frequency and ultrasonic identification used to verify the method of weight impedance electrometry, were considered.
Библиографическая ссылка
Андреев В.В., Белозеров В.В. ABOUT METHODS OF CONTROL OF PARAMETERS IN THE FILLING AND SALES OF DAIRY PRODUCTS. // European Journal of Natural History. 2022. № 2. ;URL: https://world-science.ru/en/article/view?id=34254 (дата обращения: 22.07.2026).