
Scientific journal
European Journal of Natural History
ISSN 2073-4972
ИФ РИНЦ = 0.204
OFFLINE AND ONLINE MATH LEARNING OF ENGINEERING STUDENTS IN TRANSPORT UNIVERSITY

Statistical analysis is an important method for pedagogical research. The COVID-19 pandemic has affected at the changing pedagogical technology of the learning. Online learning technology has replaced offline learning technology in many universities around the world. University teachers and students must have competencies to work with modern internet technologies and different software for online learning. Online learning will be effective if university teachers and students have good computer hardware and gadgets. Pedagogical observation shows that students have such inconveniences during online learning as the need for time to study, which doesn’t correspond to the timetable, unsure in solving tasks and exercises, inability to independently understand the learning material. Creative university math teachers offer to use various e-learning systems [1], virtual learning objects [2], learning platform [3], mobile learning [4] and social network platforms [5] for online learning. Statistical analysis helps to estimate the effectiveness of the different pedagogical technologies.
Purpose of the research. The purpose of the research is to identify the difference between offline and online math learning of engineering students in Ural State University of Railway Transport and to make a statistical analysis of the face-to-face communication and virtual communication technologies results.
Materials and methods of research
Unified portal of Internet testing in professional education protocols are materials in this research. The datasets are compiled according to the protocols of the final math testing results for two periods (offline learning and online learning). The learning program determines the content of testing. The two-level scale was used to measure students’ math academic achievements. The research of the difference between the effectiveness of offline math learning and online math learning is based on the nonparametric statistics methods [6, 7]. The McNemar’s criterion and the sign test are used for researching related datasets.
Results of the research and discussions
Modern higher education has different forms and types of learning and e-learning. Information and telecommunication technologies have become widely used in offline and online learning. Offline learning was more priority than online learning before the COVID-19 pandemic in university. Students preferred to attend lessons and talk with the teacher in the classrooms, discuss news with groupmates in the student cafe during breaks, read books in the university library in offline learning. Online e-learning has become priority than offline learning during the COVID-19 pandemic in university. Students attended classes and communicated with the teacher in virtual classroom, discussed news with classmates in a chat, read books on the Internet in online e-learning. Some offline and online learning characteristics are presented in Table 1.
Math is one of the main academic subjects at the engineering faculties of the Transport University. The math teachers of the Ural State University of Railway Transport have made a good methodic system for teaching math to engineering students. The math learning lasts two years (four semesters). The math methodic system is used for offline and online learning. Its effectiveness can be estimated by research the students’ math academic achievements results in offline and online learning. Students learned online for only one academic year (2020–2021) therefore it is possible to research the effectiveness of the math methodic system only for first-year engineering students. Math education content for first-year engineering students is presented in Table 2.
Students’ math competencies are estimated by tests at the end of the first and second semesters. These tests can be found on the unified portal of Internet testing in professional education. The testing portal has a huge library of math tasks. It allows generating to university math teachers a many individual tests versions. Each student will know their result immediately after finishing of test. If a student has made a mistake, the testing system automatically informs him about correct decision in his protocol. Students’ protocols are placed in their personal account. The report about the students’ testing results is placed in the university teacher personal account. Description of math learning achievement levels are presented in Table 3.
Table 1
Some characteristics of learning technologies
|
Offline learning (face-to-face communication) |
Online learning (virtual communication) |
|
The teacher sees all the students in the classroom and all the students see the teacher |
The teacher sees a list of students who is online and all students see the teacher only by the video camera |
|
The teacher controls visually the students’ activities and the students see the teacher’s reaction to their work |
The teacher doesn’t control visually the students’ activities and the students don’t see the teacher’s reaction to their work |
|
The teacher and students discuss difficult problems verbally and see each other’s emotions and gesticulations |
The teacher and students discuss difficult problems verbally and can’t see each other’s emotions and gesticulations |
|
The teacher finds mistakes in the student’s work during the lesson and instantly informs him about it and controls its correction |
The teacher doesn’t see the students’ work during the virtual lesson and can’t find their mistakes |
|
Face-to-face communication increases the learning work rhythm |
Virtual communication reduces the learning work rhythm |
Table 2
Math learning program of first-year engineering students
|
Period |
Content |
Control |
|
I semester |
Matrices and determinants, systems of linear algebraic equations, vectors and actions on its, second-order curves, a plane and a straight line in space, one variable function and limit calculation |
First semester final math test from the unified portal of Internet testing in professional education |
|
II semester |
Differential computation, several variables function, complex numbers, indefinite and definite integral, definite integral applications, definite integral approximate calculations |
Second semester final math test from the unified portal of Internet testing in professional education |
Table 3
Math learning achievements distribution
|
Level |
Math learning activity |
Indicator |
|
Basic (B) |
Student knows math definitions and formulas, solves simple typical math tasks correctly, does simple math transformations well |
Correct completion tasks 60% – 85% of final math test from the unified portal of Internet testing in professional education |
|
Over basic (OB) |
Student knows math definitions and formulas, solves simple and difficult typical math tasks correctly, does simple and difficult math transformations well |
Correct completion tasks 85% – 100% of final math test from the unified portal of Internet testing in professional education |
Table 4
Distribution of final math testing results by first-year engineering students
|
2018–2019 academic year |
2020–2021 academic year |
||||||||
|
II semester I semester |
Level |
Σ |
II semester I semester |
Level |
Σ |
||||
|
Basic |
Over basic |
Basic |
Over basic |
||||||
|
Level |
Basic |
27 |
36 |
63 |
Level |
Basic |
33 |
26 |
59 |
|
Over basic |
6 |
17 |
23 |
Over basic |
13 |
13 |
26 |
||
|
Σ |
33 |
53 |
86 |
Σ |
46 |
39 |
85 |
||
University teachers have information about the number and percentage of correctly completed tasks by each student from the report. They have the opportunity to make a statistical analysis of the testing results. First-year engineering students groups are selected randomly for online e-learning (2020–2021) and offline learning (2018–2019) for our research. Students’ math achievements results are presented in Table 4.
The comparative analysis of the 2018–2019 academic year results (Table 4) shows that 31% of students retain a basic level of math competence, 20% of students retain over basic level of math competence, 42% of students improve their math achievements and 7% of students degrade their math achievements during offline learning (Fig. 1). The comparative analysis of the 2020–2021 academic year results (Table 4) shows that 39% of students retain a basic level of math competence, 15% of students retain over basic level of math competence, 31% of students improve their math achievements and 15% of students degrade their math achievements during online e-learning (Fig. 2).
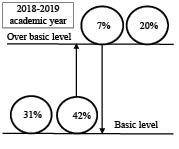
Fig. 1. Changing of students’ math achievements (offline learning)
The difference of final math testing results of first-year engineering students during academic year is verified by statistical hypothesis checking by McNemar’s criterion (Table 5).
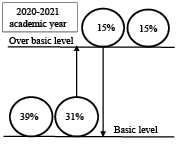
Fig. 2. Changing of students’ math achievements (online e-learning)
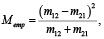
McNemar’s criterion M is used to compare related datasets. Its empirical value Memp is calculated by the formula:
 (1)
(1)
where m12 – the number of students moving the first level (basic) to the second level (over basic), m21 – the number of students moving from the second level (over basic) to the first level (basic).
McNemar’s criterion critical value Mcr(α) on significant level α is determined by the table [8]. If Memp is less than Mcr(α) or equal to Mcr(α) then statistical the hypothesis H0 is accepted. If Memp is more than Mcr(α) then the statistical hypothesis H1 is accepted. Two values Memp1 equal 21.4 and Memp2 equal 4.33 more than Mcr(0.05) equal 3.84 (Table 5) for the significance level α is 0.05. This means that statistical hypotheses H11 and H12 are accepted (Table 5). The math methodic system influences to the changing math competencies of first-year engineering students as for offline learning and as for online e-learning.
Table 5
Verification of statistical hypotheses by the McNemar’s criterion
|
i |
Statistical hypothesis |
Memp i |
Mcr(0.05) |
|
|
H0i |
H1i |
|||
|
1 |
The difference in the final math testing results of the engineering students in the first and second semesters of the 2018-2019 academic year wasn’t significant |
The difference in the final math testing results of the engineering students in the first and second semesters of the 2018-2019 academic year was significant |
21.4 |
3.84 |
|
2 |
The difference in the final math testing results of the engineering students in the first and second semesters of the 2020-2021 academic year wasn’t significant |
The difference in the final math testing results of the engineering students in the first and second semesters of the 2020-2021 academic year was significant |
4.33 |
|
Table 6
Statistical analysis of math testing changing results
|
Level transition |
Description |
Shift |
Number of students |
|
|
2018–2019 |
2020–2021 |
|||
|
B → B |
The student correctly solved from 60% to 85% of the tasks in the final math test for the first and second semesters |
Zero |
27 |
33 |
|
B → OB |
The student correctly solved from 60% to 85% of the tasks in the final math test for the first semester and increased the percentage of correctly solved tasks in the final math test for the second semester |
Positive |
36 |
26 |
|
OB → B |
The student correctly solved from 85% to 100% of the tasks in the final math test for the first semester and decreased the percentage of correctly solved tasks in the final math test for the second semester |
Negative |
6 |
13 |
|
OB → OB |
The student correctly solved from 85% to 100% of the tasks in the final math test for the first and second semesters |
Zero |
17 |
13 |
Table 7
Verification of statistical hypotheses by the sign test
|
i |
Statistical hypothesis |
Gemp i |
n |
Gcr(0.05, n) |
|
|
H0i |
H1i |
||||
|
1 |
The positive level shift in final math testing results of the engineering students was random in the 2018–2019 academic year |
The positive level shift in final math testing results of the engineering students wasn’t random in the 2018–2019 academic year |
6 |
42 |
15 |
|
2 |
The positive level shift in final math testing results of the engineering students was random in the 2020–2021 academic year |
The positive level shift in final math testing results of the engineering students wasn’t random in the 2020–2021 academic year |
13 |
39 |
13 |
The information about level shifts in final math testing results of first-year engineering students is presented in Table 6.
The level shifts of final math testing results of first-year engineering students during academic year are verified by statistical hypothesis checking by sign test (Table 7).
Sign test G is used to compare related datasets. Its empirical value Gemp is number of negative shifts. Sign test critical value Gcr(α, n) on significant level α for freedom degrees number n (number of positive and negative shifts) is determined by the table [9]. If Gemp is more or equal to Gcr(α, n) then the statistical hypothesis H0 is accepted. If Gemp is less than Gcr(α, n) then the statistical hypothesis H1 is accepted. Value Gemp1 is 6 and it is less that Gcr(0.05, 42) (Table 7). This means that the statistical hypothesis H11 is accepted (Table 7). The math methodic system doesn’t influence randomly to the changing math competencies of first-year engineering students for offline learning. Value Gemp2 is 13 and it equals to Gcr(0.05, 39) (Table 7). This means that the statistical hypothesis H02 is accepted (Table 7). The math methodic system influences randomly to the changing math competencies of first-year engineering students for online learning. The results of this research don’t conflict with the results of other researchers [10].
Conclusion
The statistical analysis of math testing results use made it possible to identify trends in the math student’s competencies in the randomly selected groups. Online e-learning is a new and interesting phenomenon in modern education. Its features need to correct the traditional math methodic system for university students. Formation of positive motivation, stimulation of note-taking in the virtual class [11] and improvement the methodic system for task solving [12] remain important factors in university math online e-learning. Weak feedback between university teacher and students reduces the e-learning effectiveness in a virtual class. The impotence of the student’s independent work is increases without face-to-face communication.
Библиографическая ссылка
Куликова О.В., Пирогова И.Н., Филиппова Е.Г., Борисова Н.О., Куликова И.В. OFFLINE AND ONLINE MATH LEARNING OF ENGINEERING STUDENTS IN TRANSPORT UNIVERSITY // European Journal of Natural History. 2022. № 2. ;URL: https://world-science.ru/en/article/view?id=34253 (дата обращения: 18.06.2026).
DOI: https://doi.org/10.17513/ejnh.34253