
Scientific journal
European Journal of Natural History
ISSN 2073-4972
ИФ РИНЦ = 0.204
ABOUT METHODS AND MEANS OF COMPARATIVE ANALYSIS OF PACKAGED LIQUID PRODUCTS

In accordance with the Decision of the State Commission for Combating Illicit Trafficking in Industrial Products [1], Roskachestvo, together with Rosaccreditation, Rospatent, Rosstandart and Rosselkhoznadzor, conducted an unprecedented study of the Russian market of bottled drinking water, including mineral canteen, medical and medical canteen. More than two hundred trademarks purchased in seven federal districts of the country (Central, NorthWestern, Volga, Southern, North Caucasus, Ural, Siberian) were investigated for quality, chemical safety and falsification [2]. The results of the inspection are alarming: for example, 59 brands showed signs of counterfeit products; 6 brands had nitrates and nitrites in elevated concentrations, indicating problems with water treatment; residual chlorine was found in drinking water of natural origin of one brand, and in another (medical canteen) – an increased content of manganese. More than 40 brands of mineral water contained an indication of mineralization groups, but at the same time, being manufactured not according to the State standard, they misled the consumer [2], i.e., in fact, these brands do not have the declared therapeutic effect.
In addition, the methods and means currently used to control the quality and safety of bottled drinking water are ineffective and require additional non-production and time costs, such as removing the finished product from the places of sale, transportation, storage and laboratory testing [3], and the selective control method does not guarantee the quality of each product in the entire batch, which, in our opinion, requires a radical change in the policy of supervision and controls: it is necessary to develop and implement automated systems of continuous output control and effective express methods and means of input parameter control [3].
In this article we will talk about a fundamentally new approach to the implementation of the above tasks, in relation to liquid packaged food products (LPFP) using the method of comparative analysis and a portable automated complex (PAC) implementing it, protected by a patent of the Russian Federation [4], the use of which is potentially capable of completely eliminating the adulteration of bottled waters, as well as becoming an appropriate subsystem in the “National Food Quality Management System” [3].
Objective of the study is to improve the effectiveness of quality control and safety of liquid packaged products.
Material and methods of research
As our research has shown, liquid packaged food products are sold in various containers (polymer, glass, etc.), filling into which, as a rule, is carried out by automated lines and installations, and their compliance and quality, in addition to determining the chemical composition, can be identified by density, kinematic and dynamic viscosity, freezing point and flash (self-ignition), alkaline and acid number, color, transparency and turbidity, dielectric permittivity, conductivity, characteristic oscillation frequency, etc. [3, 4]. Also, recently, ready-made solutions based on comparative analysis have become increasingly popular, i.e. using the method of comparing “images” (acoustic, electrical, mechanical, etc.) of the standard and the manufactured product, or/and finding relationships between various parameters, in particular, bottled water [5].
For example, the portable safety device “Latest 3.0” (Fig. 1), using the method of quasi-static electro-field tomography, makes it possible to assess the spatial distribution of the electrical properties of the medium and, thereby, determine the characteristics of the liquid in a closed non-metallic vessel without violating its tightness [6]. Potentials are induced on the measuring electrodes of the device, the magnitude of which depends on the voltage source, the distance between the active electrode and the measuring electrodes and the complex dielectric permittivity of the medium, which, together with the conductivity, makes it possible to unambiguously assess its danger (Table 1) [6].
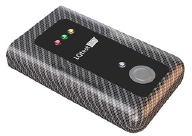
Fig. 1. Portable safety device LQtest 3.0
Table 1
Electrical properties of the liquid
|
№ |
Liquid |
Electrical conductivity, cm/m |
Dielectric constant |
|
1 |
Water, soft drinks |
0.01- |
81 |
|
2 |
Ethanol |
10 |
25 |
|
3 |
Acetone |
10 |
21 |
|
4 |
Nitroglycerin |
- |
19 |
|
5 |
Ether |
- |
4.3 |
|
6 |
Gasoline, diesel fuel |
10 |
2 |
In addition to determining the dielectric properties of the medium, one of the most important positions is occupied by density meters, including ultrasonic density meters, since the density of a liquid determines such important indicators as the composition and properties of a substance. The principle of operation of the ultrasonic analyzer (Fig. 2) is based on the fact that ultrasonic vibrations are passed through the sample and ultrasound characteristics are recorded depending on the concentrations of substances in liquid media and the temperature of the sample, after which the closest dependence of the ultrasound propagation velocity on temperature is selected from a family of pre-established calibration dependencies and this velocity is calculated according to the formula [7, 8]:
Vi = kTm + qi,
where Vi is the velocity of ultrasound propagation for each dependence; Tm is the measured temperature of the liquid under study; ki and qi are constant coefficients for each liquid from the entire class, and the determination of absolute deviations by the formula:
ΔVi = |Vm + Vi |,
where ΔVi is the absolute deviation of the ultrasound propagation velocity for each dependence; Vm is the measured ultrasound propagation velocity.
Further, the two smallest deviations ΔVi and ΔVi+1 will determine the nearby dependencie V1(T) and V2(T) from the family of pre-established dependencies, and the recalculation of the ultrasound propagation velocity into the density of the liquid is performed according to the theoretically established dependence [8]:
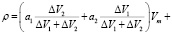
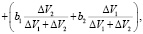
where a1, a2, b1, b2 are constant recalculation coefficients for two nearby dependencies V1(T) and V2(T); ΔV1, ΔV2 are absolute values of velocity deviations calculated from the previously established dependencies V1(T) and V2(T)
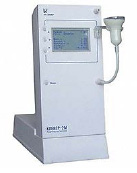
Fig. 2. Ultrasonic density meter ULIKOR Clover-2M
It is possible that the ULICOR can be modified for a non-contact method (without sampling) and these methods and means of comparative analysis are able to determine the type and density of the packaged liquid in a few seconds, without opening the container. At the same time, it is essential that they have high mobility, measurement accuracy, do not require highly qualified personnel, and, thanks to the presence of communication interfaces, they can exchange data with a computer.
However, to create a national quality assurance system for liquid packaged foods, determining only the type and density is not enough. It is necessary to form a system of continuous output control at the manufacturing enterprise and input control at the places of sale of the product, which will be able to determine the quality parameters of liquid packaged foods. That is why the method of weight impedance electrometry (WIE) was developed and protected by the patent of the Russian Federation for the invention [3, 4].
Results of the study and discussion
The essence of the method of weight impedance electrometry lies in the fact that, with the introduction of a sensor-lid at the stage of packing, it becomes possible to measure the electrophysical parameters of the liquid (density, conductivity, dielectric permittivity, characteristic frequency, etc.) without breaking the tightness of the package, i.e. to determine the “image” of the liquid under study, compare it with the “image of the standard” and calculate the similarity criteria (electrodynamic, electromagnetic, dielectric, electro-inductive and electric capacity) [3, 4].
To implement such a comparative analysis of liquid packaged foods, a portable automated complex (PAC) was developed, the block diagram of which is shown in figure 3.
The installation for the implementation of the express analysis method consists of a laptop with connection to it via the appropriate interfaces of electronic scales and an E7-25 immitance meter (frequency range from 1 Hz to 1 MHz) [9], which is connected to a contact platform, for connection to a lid sensor that clogs PET containers where water is packaged, and with the help of appropriate software controlled by a laptop, performing liquid identification and determination of its quality within ten seconds, by comparing the measured and calculated parameters with the entered/stored in memory parameters of the standards. At the same time, the stationary automated continuous monitoring complex of the water manufacturer has the same structure, except for the use of the E7-29 immitance meter, which has a range from 50 kHz to 15 MHz [10], which allows determining the characteristic frequency of the liquid under study [11], by measuring the electrical conductivity of the liquid for two different temperatures in the range from boiling point to freezing point (Fig.4), thanks to the design of the sensor-lid (Fig. 5), which allows heating of the test liquid inside a sealed package.
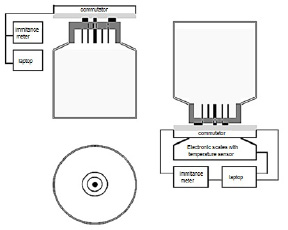
Fig.3. Block diagram of the PAC
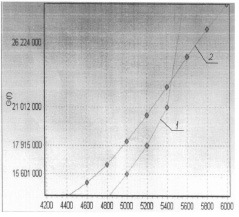
Fig. 4. Conductivity of tap water from the frequency of electromagnetic oscillations
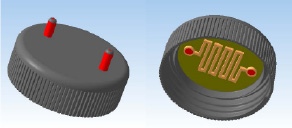
Fig. 5. 3D model of an inductive sensor-cover
Further, under computer control, an immitance meter connected to the lid sensor measures first the parameters of the gas medium inside the container, and after the bottle is turned over, the liquid parameters: capacitances (Cp), resistances (Rp), electrical conductivity (Gp), tangents of loss angles (tgδ) and leakage currents (I) at fixed frequencies [10].
In this case, the obtained data form spectra of values that are used for the subsequent calculation of the relative permittivity (ε) according to formula (1), macroscopic relaxation time (τ) according to formula (2), molecular relaxation time (τμ) according to formula (3), dynamic viscosity (η0) according to formula (4) [3, 4]:
ε = Cm / C0 (1)
 (2)
(2)
 (3)
(3)
 (4)
(4)
where C0 is the capacity of the sensor in the gas medium, pF; Cm is the capacity of the sensor in the liquid, pF; f is the frequency, Hz; ηэ and τэ are tabular data of the gas medium loaded into the computer.
And, thanks to the data from the temperature sensor and electronic scales, the density (ρ) and kinematic viscosity (v) of bottled water are calculated according to the following formulas [3, 4]:
ρ(t) = ρ20ºC – Δt·(t – 20ºC), (5)
v = η0 / ρ(t), (6)
where ρ20ºC is the density of the liquid at 20ºC, kg/m3;
Δt = (18,31 – 13,233 · ρ20ºC) · 10–4 – temperature correction to density by one degree; t – current temperature, ºC.
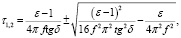
The kinematic viscosity of drinking water (ν) packaged in a container varies depending on temperature, and it is also calculated using Walter’s formulas [3, 4]:
 (7)
(7)
 (8)
(8)
 (9)
(9)
where a and b are empirical coefficients; T1 and T2 are the standard temperature of liquid and viscous media.
To identify liquid and viscous products by solidification temperature, the Walter formulas are used, with a kinematic viscosity value of 10000 mm2/s [3, 4]:

 (10)
(10)
Accordingly, in order to verify the readings of the stationary automated complex (SAC), a portable safety device “LQtest 3.0” and an ultrasonic density meter ULICOR “Clover-2M” will be used in this study. A summary table of the measured parameters is given in Table 2.
The determination of the characteristic frequency in the PAC will be carried out by calculating the approximating formulas for the frequency of 1 MHz in the event that the remaining parameters of the “image” will have a significant variance. A summary table of the “image” of water is given in Table 3.
Table 2
Measured parameters
|
№ |
Parameter |
Device |
||
|
LQtest 3.0 |
Clover-2M |
SAC |
||
|
1 |
Density |
- |
+ |
+ |
|
2 |
Conductivity |
+ |
- |
+ |
|
3 |
Dielectric constant |
+ |
- |
+ |
|
4 |
Characteristic frequency |
- |
- |
+ |
Table 3
«Image» of water
|
№ |
Name of the parameter |
Designation |
Dimension |
Range of variation |
|
1 |
Product weight |
m |
kg |
0,25 – 20 |
|
2 |
Product scope |
V |
m3 |
(0,25 – 20) Ч |
|
3 |
Product density |
ρ |
kg/m3 |
990–1000 |
|
4 |
Electrical conductivity |
G |
S |
0,000001–0,2 |
|
5 |
Resistance |
R |
Ω |
5 – 106 |
|
6 |
Leakage current |
I |
A |
10-6 – 0,2 |
|
7 |
Capacity (with a capacitive sensor) |
C |
pF |
10-3 – 1012 |
|
8 |
Inductance (at induct. sensor) |
L |
nH |
30 – 120 |
|
9 |
Temperature |
Т |
ºС |
1 – 50 |
|
10 |
Measuring equipment |
tgδ |
- |
10-6 – 5-3 |
|
11 |
Specific electrical conductivity |
σ |
mkS/cm |
50 – 1500 |
|
12 |
Magnetic permeability |
m |
H/m |
(8 – 9) Ч |
|
13 |
Complex resistance module |
|Z| |
Ω |
900 – 9500 |
|
14 |
The shear angle of the complex resistance |
φ |
° |
minus 180° – plus 180° |
|
15 |
Kinematic viscosity |
ν |
m2/s |
(0,3 – 1,8) Ч |
|
16 |
Dynamic viscosity |
η |
NЧ |
(0,3 – 1,8) Ч |
|
17 |
Frequency |
f |
Hz |
10 – 106 |
|
18 |
Dielectric constant |
ε |
- |
60 – 90 |
|
19 |
Characteristic frequency |
Fx |
kHz |
2500 – 5450 |
Conclusion
The presence of counterfeit goods on the market of liquid packaged products is partly due to the low efficiency of the methods and means used to control quality and safety parameters. The development and implementation of express methods of comparative analysis and automated systems of continuous output and input control is potentially capable of completely eliminating the adulteration of Liquid packaged food products, bottled water in particular, and thus becoming an appropriate subsystem in the “National Food Quality Management System”.
To carry out express diagnostics of liquid packaged food products, without opening containers and sampling, it is necessary, firstly, the introduction of sensor-covers at the packaging stage, secondly, the formation of a unified database of “images” of standards using manufacturers’ data, thirdly, the organization of appropriate subsystems (manufacturers, trade enterprises and state supervision bodies).
Библиографическая ссылка
Мартынов В.В., Белозеров В.В. ABOUT METHODS AND MEANS OF COMPARATIVE ANALYSIS OF PACKAGED LIQUID PRODUCTS // European Journal of Natural History. 2022. № 1. ;URL: https://world-science.ru/en/article/view?id=34230 (дата обращения: 21.06.2026).