
Scientific journal
European Journal of Natural History
ISSN 2073-4972
ИФ РИНЦ = 0.204
PRINCIPAL COMPONENT ANALYSIS APPLIED TO SATELLITE IMAGERY FOR VOLCANIC PLUME DETECTION OVER KURIL AND KAMCHATKA REGION

Volcanic eruptions in Russian Far East mostly occur on Kamchatka Peninsula and The Kuril Islands, which are the part of The Ring of Fire – a chain of volcanoes around the Pacific Ocean. At the same time, ones of the most important international airways lie over that region, such as transpacific routes from Southeast Asia to America and Europe. Beside them there are plenty of regional airways. So, the vast part of the international economy depends on the right forecasting, adequate and punctually actions for preventing aircrafts’ getting into the unfavourable conditions. The importance and convenience of satellite sensing is undoubtable in such fields of studies as volcanic plume observations where it provides a simple way for cloud recognition and tracking.
When getting in volcanic ash cloud, an aircraft could suffer serious damage. One of the major threats for aviation lies in the properties of the ash particles which are ≤ 2 mm in diameter, consisting mostly of siliceous and vitreous materials. Melting temperature of ash components coincide with operating temperature in most jet engines, which is around 1200-1400°C while morphological metamorphosis starts at 670-800°C. This leads to melting and accumulation of volcanic material on the engine blades, compressor and other inner parts, and, in turn, to engine failure. Damage is dealt not only to engines, but also to Pitot tubes which could not indicate airspeed correctly being blocked by the ash; cockpit and cabin windows, making them blind; wings and fuselage surfaces, as these particles act like an abrasive material. Besides the ash particles, sulphur dioxide, chlorine and other corrosive gases could be contained in the plume. The plume could also remain in the atmosphere for quite a long time and transported over thousands of kilometres, thus it is important not only to monitor the process of eruption itself and in the vicinity of volcano, but also to trace plume throughout its persistence period. Along with the significant residence time, another problem caused by ash presence in the troposphere is the acid rains. Another harmful phenomenon, associated with eruptions is the ashfall. This is a fallout of ash particles, in a relatively short time after eruption. The ashfall reduces visibility, blocks sunlight, worsens total grip on airport runways and roads, could act like a corrosive and abrasive material and cause electrical short circuits. As the ash material is quite dense, it may also cause roofs’ collapses. Although it is not highly toxic, it may cause breathing obstructions.
Globally, the problem of avoiding ash clouds emerged in 1980s with the broad development of high-level flights and concerns heightened in 2010 when the eruption of Eyjafjallajökull volcano in Iceland impacted the air transport all over Europe and North Atlantic. This event led to great economic losses. The International Civil Aviation Organization (ICAO) is constantly developing and improving its manuals on the aviation safety concerning the hazards of volcanic activity. To maintain desirable smoothness and promptness of the implementation, volcanic ash exercises (VOLCEX) are held regularly, with frequency determined by the ICAO. Flight documentation nowadays includes reports on latest occurred events in form of SIGMET, NOTAM and VONA messages and is included in METLINK information system.
Ways of plumes detecting and satellite imaging processing, comparison of two detecting methods are presented in this article.
Purpose of the research
This study is dedicated to similarities evaluation in volcanic plumes’ properties in certain region with implementation of remote sensing techniques. Another point is to compare PCA results with Ash-RGB model by Eumetsat – European Organization for the Exploration of Meteorological Satellites for various conditions of research.
Sources and methods of the research
Advisory information on volcanic ash is provided by Kamchatka Volcanic Eruption Response Team [1].
Source of MODIS products is The Level-1 and Atmosphere Archive & Distribution System (LAADS) Distributed Active Archive Centre (DAAC) [2].
Eumetsat Ash-RGB model was originally developed to be used with SEVIRI (Spinning Enhanced Visible and Infrared Imager) data [3], but in course of further researches it showed accurate results while being applied to MODIS data. It is mostly aimed to detect SO2 clouds within volcanic plume. The basics of the method are following: brightness temperature difference between infrared (IR) channels 12.0-10.8 μm depicts thin volcanic ash, difference between IR 10.8-8.7 μm depicts SO2 gas plume due to its absorption at 8.7 μm, IR 10.8 μm band is for cold clouds detection.
These channels are widely-used in various ash detection techniques beside mentioned in the article, such as, for example, reverse absorption technique.
However, there are some limitations of this method. Thick ash clouds could not be discriminated from ice clouds, low-level plumes could be covered by high-level clouds, presence of ash and SO2 in cirrus clouds might be problematic. Colours of the visible structures may vary due to dependence on viewing angle, concentration, cloud transparency, water vapour content and temperature.
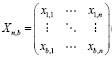
The PCA is applied with multispectral images. The input images have to share the same dimensions (rows and columns), pre-processing level, number of bands, format and for preference the same incidence angle. The aim of using PCA is dimensionality reduction of the data to maximize the amount of information from the original bands into the least number of PC, in this case, the number of original bands. A set of correlated variables (original bands) is transformed in other uncorrelated variables (PC) which contain the maximum original information with a physical meaning that needs to be explored. Assuming a multispectral image with N input bands it can be expressed in matrix format in the following way:
 (1)
(1)
where n represents the number of pixels and b the number of bands. Considering each band as a vector, the matrix can be simplified as follows:
 (2)
(2)
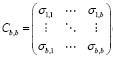
where k is the number of bands. To reduce the dimensionality of the original bands the eigenvalues of the covariance matrix must be calculated as follows:
 (3)
(3)
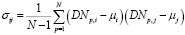
where σij is the covariance of each pair of different bands.
 (4)
(4)
where DNp,i is the digital number of the pixel p in the band i; DNp,j is the digital number of the pixel p in the band j; μi and μj are the averages of the DN for the bands i and j, respectively. From the variance–covariance matrix, the eigenvalues (λ) are calculated as the roots of the characteristic equation:
 (5)
(5)
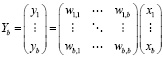
where C is the covariance matrix of the bands and I is the diagonal identity matrix. The eigenvalues indicate the original information that is retained. From these values the percentage of original variance explained by each PC can be obtained calculating the ratio of each eigenvalue in relation to the sum of all them. The PC can be expressed in matrix from:
 (6)
(6)
where Y is the vector of the principal components, w the transformation matrix, and x the vector of the original data. The coefficients of the transformation matrix w are the eigenvectors that diagonalized the covariance matrix of the original bands. These values provide information on the relationship of these bands with each PC (Figure 1). From these values it is possible to link a main PC with a real variable. The eigenvectors can be calculated from the vector–matrix equation for each eigenvalue λk.
 (7)
(7)
where C is the covariance matrix, lk is the k eigenvalues (eight in a SPOT multitemporal composition), I is the diagonal identity matrix, and Wk is the k eigenvectors [4,5,6].
Mathematically, having spatially distributed values, 1st principal component (PC) lies along the general values’ variation vector, then if the noise is still unacceptable, 2nd principal component is introduced perpendicular to the first one, describing variations along this vector, and so on. So, the first principal component (PC1) contains more information, the second one describes the dispersion of the data which was not taken into account due to orthogonality of the PC with lower order. Consequent ones contain less and less information and noise. If two values are somehow correlated, the distribution would have an ellipsoidal shape. The aim of the PCA is to define direction of the ellipse’s major axis – PC1. Obviously, PC2 is the ellipse’s minor axis. Number of principal components equals the dimensionality of a space and every consequent principal component is orthogonal to previous one. Also, analysing the last PCs could reveal such fine details that were shaded by high contrast in initial image, after the elimination of higher-order PCs’ influence. Thus, as high-order PCs contain noise mostly, the reverse implementation of valuable principal components provides noise reduction.
The PCA is designed for highly-correlating data processing, which is spectrally close MODIS bands.
Results of the research and discussions
10 cases of volcanic eruptions occurred in Kuril and Kamchatka region during 2018-2020 period had been studied in course of this research. One of them is presented in this paper, illustrating various ways of used methods application. Images were processed with Ash-RGB method by Eumetsat and by principal component analysis. Input thermal infrared images, difference images used for Ash-RGB model and principal component images are shown in fig. 2. The term of principal component image (PCI) was introduced by Hillger in 1996 (Meteorological analysis using principal component image transformation of GOES imagery, International Radiation Symposium-96, Fairbanks, AK) [7].
Fig. 3 depicts scatter plots for initial MODIS bands 29 and 31; 29 and 32; 31 and 32 (a-c); 32-31 difference and 31-29 difference; 31-29 difference and 31; 32-31 difference and 31 (d-f); PC1-PC2; PC1-PC3; PC3-PC2 (g-i).
Following table (table 1) shows the contribution each of three components makes in total dispersion, correlation and covariation matrices.
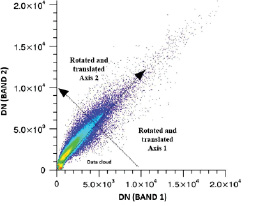
Fig. 1. Graphic representation of PCA rotation [4]
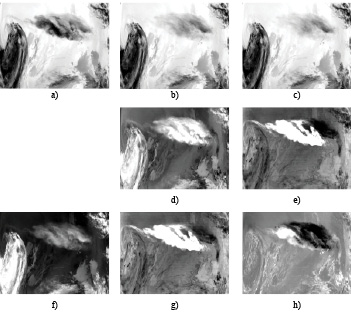
Fig. 2. Thermal IR and difference images, used for Ash-RGB image composition: a) 8.6 μm, b) 11 μm, c) 12 μm, d) 12-11 μm difference; e) 11-8.6 μm difference; f) PCI-1; g)PCI-2; h) PCI-3
Table 1
the contribution of each of the three components to the overall variance, correlation and covariance matrices
|
Var/Covar |
1 |
2 |
3 |
|
1 |
2084.00 |
1912.30 |
1943.68 |
|
2 |
1912.30 |
1907.05 |
1963.63 |
|
3 |
1943.68 |
1963.63 |
2034.29 |
|
Cor Matrix |
1 |
2 |
3 |
|
1 |
1.000000 |
0.959236 |
0.943997 |
|
2 |
0.959236 |
1.000000 |
0.996948 |
|
3 |
0.943997 |
0.996948 |
1.000000 |
|
Component |
C1 |
C2 |
C3 |
|
% var |
97.74 |
2.20 |
0.06 |
|
Eigenval. |
5888.99 |
132.74 |
3.61 |
|
Eigvec.1 |
0.583014 |
-0.804890 |
0.110669 |
|
Eigvec.2 |
0.563205 |
0.302208 |
-0.769071 |
|
Eigvec.3 |
0.585572 |
0.510709 |
0.629509 |
|
Loading |
C1 |
C2 |
C3 |
|
1 |
0.980055 |
-0.203137 |
0.004604 |
|
2 |
0.989706 |
0.079731 |
-0.033446 |
|
3 |
0.996310 |
0.130458 |
0.026507 |
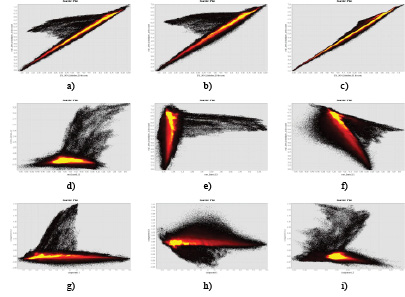
Fig. 3. Scatter plots for: a) 8.6 and 11 μm; b) 8.6 and 12 μm; c) 11 and 12 μm; d) (12-11) and (11-8.6) μm; e) (11-8.6) and 11 μm; f) (12-11) and 11 μm; g) PC1 and PC2; h) PC1 and PC3; i) PC3 and PC2
Table 2
Colour interpretation of RGB images
|
Ash-RGB |
PCA |
Relates to: |
|
|
■ |
Thin volcanic ash |
||
|
Thick volcanic ash |
|||
|
SO2 gas plume |
|||
|
Mixed ash and SO2 gas |
|||
|
Water clouds |
|||
|
Ice clouds |
It is clear that the first principal component describes 97.74% of variance on the scene.
As could be seen from fig. 3, the initial channels themselves don’t fully describe the desirable variances. Band differences used in SEVIRI Ash-RGB technique are aligned along the axis, but principal components (fig. 3, g-i) are more informative as they are stretched along the variation axis in 3 ways. This shows data distribution with high dynamic range along the maximum dispersion axis clearly.
Combining PCIs in RGB-image led to following results (fig. 4). Colour interpretation of RGB images is given in Table 2.
These are nighttime images. As seen, either SEVIRI Ash-RGB model or PCA provides clear view on location of volcanic plume. Here, area contaminated with thin ash plume and SO2 mixture (shades of yellow in fig. 3, a) differentiates from ash cloud (shades of red/orange). In the PCI-combined RGB image this difference is also notable: purple colours for SO2, ash and SO2 mixture is in russet colour, ash plume is in shades of lime. However, RGB-combined PCIs shows more levels of SO2 and ash concentration and the ash cloud could not be misinterpreted as an ice cloud.
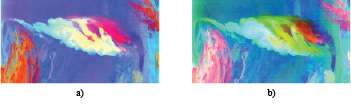
Fig. 4. a) SEVIRI Ash-RGB image; b) PCI-combined image – for mixed ash SO2 plume
Based on surveyed example, SEVIRI Ash-RGB technique showed more accurate results in distribution of SO2 components mostly. Principal component analysis is used for extraction of most informative channels out of the whole MODIS band range and 3 bands were found to be most informative.
Conclusions
It was stated that bands 29 (8.6 μm), 31 (11 μm) and 32 (12 μm) were tended to be more informative for ash clouds detection throughout this work. This could have found a practical implementation, as it was made in [8], where bands 30, 31, 36 were used.
Comparison of PCA and Ash-RGB model showed relatively acceptable results and the implementation of each of the technique depends on the conditions. SEVIRI Ash-RGB describes composition of the plume, points out SO2 fractions, while PCA also provides more information on concentrations and mixed ash and SO2 composition of the plume, describes more levels of plume contamination. Moreover, PCA eliminates uncertainty in case of ice clouds surroundings due to more contrast view of a plume. Co-use of two methods may provide the full picture of studied events.
Библиографическая ссылка
Федосеева Н.В., Львов А.Л. PRINCIPAL COMPONENT ANALYSIS APPLIED TO SATELLITE IMAGERY FOR VOLCANIC PLUME DETECTION OVER KURIL AND KAMCHATKA REGION // European Journal of Natural History. 2022. № 1. ;URL: https://world-science.ru/en/article/view?id=34224 (дата обращения: 21.06.2026).