
Scientific journal
European Journal of Natural History
ISSN 2073-4972
ИФ РИНЦ = 0.204
STUDY OF GENETIC POLYMORPHISM AND ADAPTATION POTENTIAL TO DROUGHT STRESS OF BREAD WHEAT (T. AESTIVUM L.) OF AZERBAIJAN

Drought, one of the main negative environmental factors that has a negative impact on the growth, development and productivity of wheat. Currently, the direction of breeding varieties for resistance is widely developing. Breeding resistant varieties presupposes a good knowledge of the source material and targeted attraction of it, the use in this work of the rich arsenal of the world’s plant resources. It is necessary to increase the productivity of plants by introducing stress-resistant varieties into production, which are characterized by high yields. The creation of such varieties involves the study of the genetic diversity of populations, accumulation of information on the characteristics of plant traits. For this, it is necessary to study the gene pool of plants, assessment of plant diversity, their certification [1, 2].
Assessment of genetic diversity is carried out using various methods: traditional (morphological), biochemical (protein markers) and molecular markers. The use of genetic markers allows identification and comparison of alleles of different genotypes. Molecular markers include 3 groups: hybridization-based markers – RFLP, molecular markers based on PZR and markers for quantitative trait loci (QTL). PZR-based markers include random (RAPD, ISSR, AFLP, SRAP, etc.) and special markers (SSR, SNP, CAPS, etc.). These markers are adapted to detect differences in different DNA fragments. The use of RAPD, which includes a 10 nucleotide sequence, allows detecting random fragment polymorphism, amplified DNA fragment length polymorphism (RFLP), and single nucleotide polymorphism (SNP) [3].
Purpose of the study
The purpose of this study was to assess the adaptive potential to drought of collection samples of common wheat grown in contrasting ecological conditions (irrigated and rainfed) in Azerbaijan, in terms of yield elements, as well as to study genetic diversity using various ISSR markers.
Material and research methods
The object of the study was 30 genotypes (figure) of common wheat grown in various conditions of Azerbaijan – in Absheron (irrigation) and Gobustan (bogara). The main elements of productivity were studied: plant height, length of upper internodes, number of productive stems, number of grains of the main spike, weight of grains of the main spike, weight of 1000 grains, number of grains of 30 ears, yield). All studied genotypes of common wheat are of Azerbaijani origin.
To determine the degree of resistance of the samples to stress, the resistance coefficients were used:
Mean Productivity [MP = (Yp + Ys) / 2];
Tolerance [TOL = Yp – Ys];
Geometric Mean Productivity [GMP =  ];
];
Stress Susceptibility Index SSI = [(1 – ys/yp) / (1 –  /
/ )];
)];
Stress Tolerance Index [STI = 
 ],
],
Yp and Ys: Grain yield of each genotype under non-stress and stress conditions, respectively.
 and
and  : Mean grain yield of all genotypes under non-stress and stress conditions, respectively.
It should be noted that high values of the Stress Tolerance Index (STI), average fluidity (MP) and geometric mean yield (GMP), as well as low values of the Tolerance (TOL) and Stress Susceptibility Index (SSI) are equivalent to high resistance in the studied samples, which makes it possible to estimate them as stress-resistant [4].
Molecular analysis. The study of common wheat genotypes was carried out using 15 ISSR markers (table 3). When extracting genomic DNA, 0.1 g samples were taken from freshly harvested leaves according to the CTAB (cetyltrimethylammoniumbromide) protocol proposed by Doyle and Doyle with some modifications. The concentration and purity of the DNA molecule was determined using a NanoDrop device (Thermo, NANO DROP, 2000). The final volume of the reaction mixture for PCR sample was 20 μL and contained 2 μL of 10×PCR buffer, 2 μL of a 5 mM dNTP mix, 1.5 μL of MgCl2 (50 mM), 2 μL of each primer (15 pmol/μL), 0.1 μL of the Taq polymerase enzyme (1 U/μL), and 2 μL of isolated DNA (50 ng/μL). For multilocus intermicrosatellite analysis, 14 polymorphic ISSR primers with a length of 11–18 nucleotides were used. As a result of the optimization, the following amplification conditions were chosen: preliminary denaturation at 94 °C for 5 min; subsequent 35 cycles—denaturation at 94 °C (1 min), annealing temperature depending on the primer used (45 s), synthesis for 5 min at 72 °C; final elongation cycle at 72 °C for 10 min. Amplification was performed in a programmable T100 thermal cycler (Applied Biosystems, United States). Electrophoresis of PCR products was carried out in a 2 % agarose gel with the addition of ethidium bromide and visualization under ultraviolet light using the BioRad gel documentation system.
Statistical analysis. Analysis of the amplified fragments was carried out using the SPSS computer program. The assessment of resistance to stress was determined by the yield potential (Yp), by yield under stress (Ys), by Mean Productivity (MP), Geometric Mean Productivity (GMP), TOL – according to the obligatory decrease in yield (Yp-Ys), Stress Susceptibility Index (SSI), on the Stress Tolerance Index (STI) [5–7].
To assess the genetic diversity of wheat genotypes, a number of statistical parameters were calculated, including the genetic diversity index (GDI) and polymorphic information potential (PIC) [8].
The assessment of the genetic similarity between the samples and the construction of the dendrogram were carried out on the basis of Jacquard’s genetic similarity index, clustering was carried out using the UPGM method.
Research results and discussion
Statistical analysis. Table 1 shows the mean values for the studied traits, standard deviation (SD), standard error (SE) and coefficient of variation (CV %). Each of the studied traits was characterized by high variability. The highest coefficient of variation of features was noted for the Tolerance (CV = 10.5 %), the lowest for the Stress Tolerance Index (CV = 0.02 %). Among the common wheat genotypes studied by us, the highest Mean Productivity (MP = 48.1) was exhibited by the YBFS12 var. murinium. The highest Tolerance was recorded in the YBFS35 var. erythroleucone, which was -9.8, the highest Mean Productivity (MР = 48.1) was shown by YBFS12 var. murinium.
Table 1
Statistical indicators of traits
|
TOL |
SSI |
STI |
MP |
GMP |
Yp |
Ys |
|
|
Average |
10.8 |
0.87 |
0.75 |
39.7 |
39.1 |
46.9 |
40.3 |
|
Standard error |
1.84 |
0.14 |
0.02 |
0.71 |
0.63 |
0.66 |
1.3 |
|
Standard deviation |
10.2 |
0.82 |
0.14 |
4.0 |
3.55 |
3.7 |
7.4 |
|
Dispersion |
10.5 |
0.68 |
0.02 |
16.0 |
12.6 |
13.8 |
56 |
|
Range |
41.6 |
3.40 |
0.50 |
15.0 |
13 |
14.1 |
35 |
|
Minimum |
-9.8 |
-1.30 |
0.50 |
33.1 |
33.1 |
40.9 |
18 |
|
Maximum |
31.8 |
2.1 |
1.00 |
48.1 |
46.1 |
55 |
53 |
The geometric mean yield index is an important indicator, the presence of a high indicator indicates a significant resistance of plants to stress. This indicator was the highest in the YBFS017K-45 var. cyanotrics (GMP = 46.1).
Low index of tolerance (-1.3), indicating a high plant resistance to the action of an unfavorable environmental factor, was noted for the YBFS35 var. erythroleucon. According to the data obtained, the YBFS45 var. cianotrics, whose stress Stress Tolerance Index (STI) had the highest value at 1.0, is stress-resistant.
Analyzing the literature data of this direction, attention is drawn to the research of İmren Kutlu [9]. In his studies, the stress susceptibility index (SSI), when assessing the drought tolerance of wheat genotypes, varied in the range of 0.02-11.25. Genotypes with a Stress Tolerance of less than 1 are considered resistant [10], the range of fluctuations in the stress Stress Tolerance Index (STI) was 0.31-0.87.
Correlation analysis. Correlation analysis can provide valuable information when assessing plant genotypes [11, 12]. In this part of the research, the correlation between potential yield (Yp), yield under stress (Ys) and resistance indices was studied (Table 2).
Table 2
Correlation coefficients between Yp, Ys and indices of sustainability
|
Ys |
MP |
TOL |
GMP |
SSI |
STI |
|
|
Yp |
0,594** |
0,846** |
0,823** |
0,811** |
0,493** |
0,825** |
|
0,000 |
0,000 |
0,000 |
0,000 |
0,000 |
0,000 |
|
|
Ys |
0,841** |
0,324** |
0,834** |
0,302 |
0,841** |
|
|
0,000 |
0,004 |
0,000 |
0,289 |
0,000 |
||
|
MP |
0,811** |
0,921** |
0,412** |
0,898** |
||
|
0,000 |
0,000 |
0,000 |
0,000 |
|||
|
TOL |
0,711** |
0,697** |
0,845** |
|||
|
0,000 |
0,000 |
0,000 |
||||
|
GMP |
0,423* |
0,894** |
||||
|
0,060 |
0,000 |
|||||
|
SSI |
0,465** |
|||||
|
0,000 |
As can be seen from the data presented in the table, with the exception of the relationship between yield under stress conditions (Ys) and the stress susceptibility index (SSI), a highly significant relationship was noted between the rest of the studied indices. There is а positive correlation was noted between potential yield (Yp) and other indexes. There was a significant relationship between yield under stress conditions (Ys) and Mean Productivity (MP) (r = 0.846), between potential yield (Yp) and Stress Tolerance Index (STI) (r = 0.825). There was a positive correlation between yield under stressful conditions and potential yield (r = 0.594 **).
In the studies of Amiri et al. [13], when studying the relationship between yield under stress and potential yield in common wheat genotypes, there was a significant positive correlation (r = 0.534 **). Assessing the drought tolerance of common wheat genotypes, Farshadfar and colleagues [10] noted a highly significant relationship between potential yield and stress Stress Tolerance (r = 0.835).
A significant correlation was noted by us between the yield under stress conditions and the geometric Mean Productivity, equal to r = 0.837, between the Mean Productivity and the Geometric Mean Productivity (r = 0.921), between the Mean Productivity MP and the stress Stress Tolerance STI (r = 0.898). The relationship between TOL and STI was 0.845, between GMP and STI – 0.894, between SSI and STI – 0.465.
The literature contains information on the need to use the indicators of stress Stress Tolerance (STI), average geometric yield (GMP) and Mean Productivity (MP) for the study of drought tolerance [6]. Basically, there is a highly significant relationship between the traits of common wheat [10].
Thus, the results of our studies are consistent with the data of other authors.
Molecular analysis. Of the 20 studied primers, 15 effective primers were selected for analysis. A total of 121 fragments were identified, of which 97 were polymorphic (80 %) and 24 were monomorphic (20 %).
The number of amplified fragments varied within 6-10, the length of the obtained fragments was 80-1100 nm. On average, one primer synthesized 7.6 fragments. Most of the amplicons were found using primers UBC 840 and IS15. The number of polymorphic DNA fragments varied from 3 to 9. The smallest amplification was observed with the UBC 857 primer, the largest – with IS15. The average number of polymorphic fragments was 6. Depending on the primer, the amplified polymorphic fragments varied within 57-100 %. The average level of ISSR primer polymorphism was 79 %. The polymorphism level for UBC811 was 100 %.
Table 3
ISSR primers and their statistical parameters
|
Primers |
Repeating sequence type |
NAF |
NPF |
PIC |
Polymorphism, % |
IDG |
|
UBC808 |
(AG)8C |
6 |
5 |
0,4 |
83.3 |
0.8 |
|
UBC810 |
(GA)8T |
7 |
4 |
0,28 |
57.1 |
0.67 |
|
UBC811 |
(GA)8C |
8 |
8 |
0,44 |
100 |
0.9 |
|
UBC812 |
(GA)8 A |
6 |
5 |
0,36 |
83.3 |
0.83 |
|
UBC827 |
(AC) 8G |
6 |
5 |
0,28 |
83.3 |
0.6 |
|
UBC834 |
(AG) 8YT |
8 |
6 |
0,38 |
75.0 |
0.8 |
|
UBC840 |
(GA)8TT |
10 |
8 |
0.36 |
80.0 |
0.81 |
|
UBC857 |
(AC)8TT |
6 |
3 |
0,34 |
50.0 |
0.4 |
|
UBC868 |
(GAA)6 |
8 |
7 |
0.41 |
87.5 |
0.85 |
|
UBC873 |
(GACA)4 |
6 |
5 |
0.37 |
83.3 |
0.7 |
|
HB14 |
(CTC)3GC |
8 |
7 |
0.43 |
87.5 |
0.8 |
|
ISSR3 |
TGT (AC)7A |
7 |
6 |
0.4 |
85.7 |
0.7 |
|
ISSR16 |
CGT(CA)7C |
9 |
6 |
0.48 |
66.7 |
0.9 |
|
IS 11 |
(AGC)6G |
9 |
7 |
0.27 |
77.8 |
0.84 |
|
IS 15 |
(GA)8CG |
10 |
9 |
0.43 |
90.0 |
0.92 |
|
Average value |
- |
7.6 |
6.0 |
0.4 |
79.3 |
0.77 |
|
Total |
- |
121.6 |
97 |
- |
- |
- |
PIC significance was calculated based on 15 selected primers. It is known that dominant ISSR markers have PIC values in the range of 0–0.5 [8]. For the 15 primers we used, the PIC value varied from 0.270 to 0.48, averaging 0.4 units. The lowest PIC is noted for primer IS11, the highest is for ISR16. Of the 97 polymorphic loci obtained, 37 were more informative. The most common polymorphic loci were observed when using the (AG) 8 and (GA) 8 primer dinucleotide repeats, in which the polymorphism was 100 %.
Analysis of the data obtained showed that ISSR primers, which include repeats (AG) n, are more polymorphic, which is consistent with the results of Hajiyeva’s studies [8]. The effectiveness of using ISSR markers for studying DNA polymorphism was noted by us in other studies [1]. The high polymorphism of ISSR markers is explained by their multi-allelic and hypervariable nature.
During the research, the genetic diversity index (GDI) was calculated for each ISSR locus. The average value of the genetic diversity index for each ISSR locus was 0.77 units. The primer IS15 had the highest index of genetic diversity, equal to 0.92 units.
In our studies, although most of the genotypes belonging to the same species were grouped into one cluster, nevertheless, polymorphism was noted within this species.
Thus, based on the analysis of the data obtained and the calculated values of the main parameters determined by the informativeness of the markers, it was found that the primers we used can be recommended for characterizing the genotypes of common wheat: for assessing the polymorphism of wheat genotypes, for determining the genetic similarity and genetic distance of various species and forms. Compared to other primers, IS15 and UBC811 are distinguished as the most highly polymorphic (90 % -100 %).
Cluster analysis. It is known, that cluster analysis allows identifying genotypes and revealing similarities and differencs in plants [14]. Taking this into account, to assess the genetic relationship of the studied common wheat genotypes, the genetic similarity index was calculated by the Jacquard’s method and a dendrogram was drawn up (Figure).
When analyzing the dendrogram, attention is drawn to the fact that the samples of the same species are located quite close, and the coefficients of their genetic similarity were close to unity. The closest genotypes in the dendrogram were YBFS48 var. albidum and YBFS43 var. barbarossa, in which the genetic similarity index was 0.434. Several genotypes were the closest in the dendrogram. For a number of samples, this indicator was equal to one.
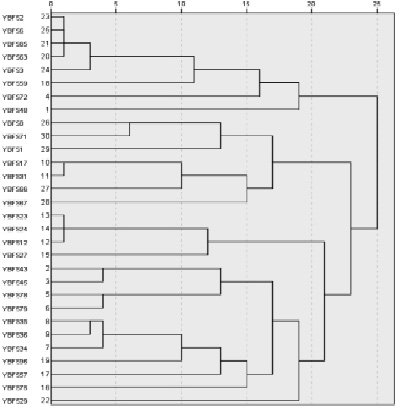
Dendrogram based on the results of ISSR analysis based on the Jacquard’s genetic similarity index
Conclusions
Thus, as a result of the statistical assessment of the indicators of the yield elements, wheat genotypes were identified that are distinguished by drought tolerance. Based on the correlation analysis, a positive significant relationship was established for most of the studied traits. Studies have confirmed the effectiveness of ISSR markers in assessing the genetic diversity and genetic relationship of common wheat genotypes. Research results can be used in breeding programs.
Библиографическая ссылка
Гаджиев Э.С., Мамедова А.Д., Аббасов М.А., Алиев Р.Т. STUDY OF GENETIC POLYMORPHISM AND ADAPTATION POTENTIAL TO DROUGHT STRESS OF BREAD WHEAT (T. AESTIVUM L.) OF AZERBAIJAN // European Journal of Natural History. 2021. № 4. ;URL: https://world-science.ru/en/article/view?id=34189 (дата обращения: 27.07.2026).
DOI: https://doi.org/10.17513/ejnh.34189