
Scientific journal
European Journal of Natural History
ISSN 2073-4972
ИФ РИНЦ = 0.204
THE INFLUENCE OF THE MEASUREMENT ERROR OF THE STUDENT’S KNOWLEDGE ASSESSMENT ON MODELING THE DISTRIBUTION FUNCTION IDENTIFYING HIM IN THE PROCESS OF ASSIMILATING KNOWLEDGE

It is known that the determinism of any human activity, including the activity in the process of assimilating knowledge by a student, is realized through randomness [1]. This is due to the random nature of the mental and somatic states of a human. In this regard, to describe student behavior in the process of assimilating knowledge, the non-classic probabilistic-statistical method of scientific research is used, according to which individual is identified by a distribution function in the information space. The article [2] describes the process of modeling the individual distribution functions of students. Two-step functions were used as model distribution functions [3].
Purpose of the study
The aim of this work is to study the influence of the error in measuring student’s knowledge on the modeling of distribution functions and on the estimation of the probability of assimilating the material of an academic discipline by an individual.
Materials and research methods
The modeling of distribution functions is based on the use of the following statements:
– there is unambiguous relation between the amount of information, measured in bits and intended to be assimilated by a student, and his knowledge assessment score, measured in points. So, for example, the maximum score of the measurement scale corresponds to the maximum amount of information, contained in an academic discipline;
– the probability of detecting a student in the entire information space (within the measurement scale) is equal to one;
– the knowledge assessment score in points (mathematical expectation), obtained by a student at the control event is known;
– the error in measuring the knowledge of students is known.
A typical two-step model distribution function in dimensionless form is shown in fig. 1. Calculation of the distribution function was carried out according to [2].
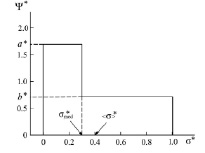
Fig. 1. Model distribution function
Here  is a model distribution function in dimensionless form;
  is a dimensionless coordinate; σ is a coordinate in points; σmax is the maximum value of the measurement scale (upper limit); Ψ(σ) is a model distribution function in ordinary coordinates;
  is the height of the left step of the distribution function in dimensionless coordinates; a is the height of the left step of the distribution function in ordinary coordinates;
  is the height of the right step of the distribution function in dimensionless coordinates; b is the height of the right step of the distribution function in ordinary coordinates;
  is a dimensionless median; σmed is a median in ordinary coordinates;
  is a dimensionless mathematical expectation; <σ> is a mathematical expectation in ordinary coordinates.
Model distribution function Ψ*(σ*) is actually a universal function. It has the same form in all the point grade measurement systems, which allows to study the behavior aspects of such a function and then to translate them to model distribution functions in any point grade measurement system, for example, in a 5-point, 20-point and 100-point grading systems. This can be achieved by changing the scale along the coordinate axes, namely, by multiplying all numbers on the ordinate axis by the maximum value of the selected scale ( ) and by dividing all numbers on the abscissa axis by the maximum value of the selected scale (Ψ(σ) = Ψ*(σ*)/σmax).
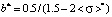
In [2] the dependences of the coefficients a*, b* and the median  on the values of the dimensionless mathematical expectation
  (knowledge assessment scores of the students) were found for the case of the relative error in the measurement of knowledge equal to δσ = 0.05 (
 , Δσ is the absolute measurement error of the knowledge assessment). Reasoning similarly to [2], we find the dependences of a*, b* and
  on
on  for certain values of the relative error δσ. Three areas of possible values of mathematical expectation are distinguished.
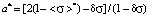
The first area of values of mathematical expectation
 :
:
 ;
;
 ;
;
 . (1)
. (1)
The second area of values of mathematical expectation
 :
:
 ;
;
 ;
;
 . (2)
. (2)
The third area of values of mathematical expectation
 :
:
 ;
;
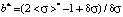 ;
;
 . (3)
. (3)
The existence of three ranges that limit the values of dimensionless mathematical expectations is due to the presence of the scale boundaries of point-grading systems, used to measure students’ knowledge, and the width of the left step in the first area and the width of the right step in the third area of model distribution functions remain invariant and equal to the relative error δσ for all the values of mathematical expectation [2]. It should also be noted that the relative error δσ influences significantly the values of a*, b* and  (systems of equations (1) and (3)) in the first and the third areas. At the same time in the second area the measurement error doesn’t affect the mentioned parameters (system of equations (2)).
Research results and discussion
Fig. 2 presents in the dimensionless, 100-point and 5-point systems of knowledge measurement the model distribution functions, that identify students, who received grades of 5, 4 and 3 points on a 5-point scale at the control event. Distribution functions for the grades of 5 and 4 points (mathematical expectations) were calculated using the system of equations (3), and for the grade of 3 points – using system of equations (2). During the calculation the relative measurement error δσ was taken equal to 0.1 (10 %).
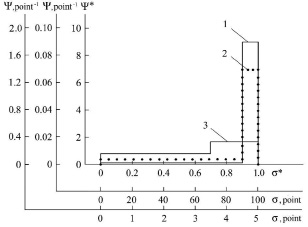
Fig. 2. Distribution functions identifying students, who received on a five-point scale of measuring knowledge: 1 – 5 points; 2 – 4 points (dotted line); 3 – 3 points
Analysis of the data presented in fig. 2 shows that distribution functions 1, 2 and 3 overlap within the range of 4.5 – 5 points. Since the error of 0.5 points, specific for a 5-point measurement system, defines the lower limit for the values of the mathematical expectation in assessing knowledge, the range of 4.5 – 5 points corresponds to a “relative” assessment of 5 points at the control event. Then the integration of any individual distribution function (probability density) over the coordinate from 4.5 to 5 points refers to the probability (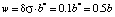 ) for a student to get a grade equal to 5 points. In this case, student who received a grade of 5 points received it for the fact that the probability of assimilating the learning material was 0.9. Students who received grades of 4 points and 3 points could have received a grade of 5 points with probabilities of 0.7 and 0.15, respectively. These probabilities are actually “conditional” probabilities of assimilating the learning material of a discipline by students. They are in fact conditioned by the error in measuring knowledge.
It follows from the above that the error in measuring students’ knowledge plays an important role in calculating the individual distribution functions and finding the conditional probabilities of assimilating the learning material of a discipline by a student. Fig. 3 presents the dependencies of the conditional probability of assimilating the learning material of a discipline on the relative error in measuring students’ knowledge.
It can be seen that with a decrease in the measurement error, the probability of assimilating the learning material by students who receive grades of 5 points tends to 1. This means, that a student with a zero error in measuring knowledge can get a 5-point grade only in case of 100 % assimilation of the learning material. In the limit its distribution function becomes equal to the Dirac delta function  , presented in dimensionless coordinates (infinitely high and infinitely narrow, square under which however is equal to 1).
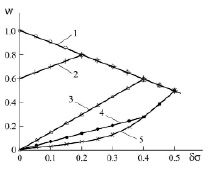
Fig. 3. Dependence of the conditional probability of assimilating the learning material of a discipline on the relative error in measuring knowledge: 1 – grade of 5 points; 2 – grade of 4 points; 3 – grade of 3 points; 4 – grade of 2 points; 5 – grade of 1 point
For students who receive a grade of 4 points at the control even, when the score measurement error tends to zero, the probability of assimilating the learning material of a discipline decreases and comes to 0.6 at zero error. Distribution function that identifies a student who receive a grade of 4 points can be written down as  . The presence of Dirac delta functions in the expressions of distribution functions for students, who received grades of 5 points and 4 points at zero error, results from the presence of the upper boundary of the measurement scale. The situation is different with distribution functions identifying students who received grades of 3, 2 and 1 points at the control event. The upper boundary of the measurement scale doesn’t influence these distribution functions when the measurement error tends to zero. In this context, when the measurement error tends to zero the probability of such students to assimilate the learning material also tends to zero, since the area where distribution functions overlap for grades of 3, 2 and 1 points and grade of 5 points becomes equal to zero. With regard to students who received grades of 3, 2 and 1 points in this case we can only talk about the probability of finding them in one or another area of the information space. The probability of finding them in the entire information space is always equal to one. It should be noted that starting with a relative measurement error of 0.2, distribution functions identifying students who received grades of 5 points and 4 points become indiscernible, and starting with a relative measurement error of 0.4 a function identifying students who received a grade of 3 points is added to indiscernible functions (the form of the distribution function, the values of the mathematical expectation and the probabilities of assimilating the learning material of a discipline coincide). Distribution functions identifying students who received grades of 2 and 1 points at the control event, starting with δσ = 0.4, coincide. With a relative measurement error of 0.5, the distribution functions of students who received grades of 5, 4, 3, 2 and 1 points become identical, that is, they completely coincide. In this regard, it becomes impossible to rank students by the level of knowledge.
In the process of assimilating the learning material of a discipline the student, commonly, engages in several types of activity such as studying lecture material, mastering methods for solving practical problems, performing a laboratory practice etc. In accordance with a labor intensity, for each type of activity a certain number of points is allocated out of 100 points given for the academic discipline as a whole. As a result of control events, for each type of activity the student receives a certain number of points, which are summed up as a result. Here, the traditional (classical) point grading method of assessing knowledge is used, according to which a student in the process of assimilating knowledge is identified by a mathematical point moving in the information space [4]. The resulting assessment of the student’s knowledge is translated from a 100-point measurement system to a 5-point system according to specified rules. However, there are currently no uniform translation rules [5, 6]. To solve this problem one can employ the results of modeling the distribution functions (fig. 2). So, at the relative error δσ = 0.1 we can unambiguously assume that the assessment ranges of 90 – 100 points, 70 – 89 points and 50 – 69 points in a 100-point measurement system will correspond to the grades of 5 points, 4 points and 3 points in a 5-point system with the conditional probabilities of assimilating the learning material of a discipline equal to 0.9, 0.7 и 0.15, respectively.
With the decrease of the relative error of measuring knowledge, the extent of overlapping of distribution functions decreases and it becomes possible to more finely rank students by the level of knowledge. So, if δσ = 0.05, a 5-point system of measuring knowledge actually turns into a 10-point system, since to assess the knowledge within the limits of error, one can use integer values as well as fractional, such as 4.5, 3.5, 2.5, 1.5, 0.5, or pass directly to a 10-point system. With the increase of the relative error of measuring knowledge, the extent of overlapping of distribution functions increases and, hence, the resolution capability of assessment of student’s knowledge drops. For example, at δσ = 0.2 distribution functions identifying students who received 5 points and 4 points at the control event, as was mentioned above, completely coincide and, hence, student ranking by the level of knowledge in this case lose its meaning. Such large errors can be realized in practice. So in [7] it is shown, that when using a 5-point scale examiner in some cases gives the grades with an absolute error of ±1 point, that is, with a relative error of 20 % (δσ = 0.2). It follows that for the same knowledge, a student can be assessed by different examiners for “2”, “3” or “4”. Moreover, in [7] it is noted that the same examiner at different moments of time, for example with an interval of one month, also can assess the same answer differently (the experiments include videos recordings of the examinees’ answers). Such large errors are due to the imperfection of a “measuring instrument”, which is a human, whose activity entirely depends on his psychosomatic state, which is constantly changing in a random way.
Conclusions
1. Systems of formulas (1) – (3) have been obtained allowing for the different values of errors in measuring students’ knowledge (mathematical expectations) to calculate distribution functions, that identify a student in the process of assimilating knowledge.
2. With the increase of the error of measuring knowledge, the extent of overlapping of distribution functions increases and, hence, the resolution capability of the method drops. So, at 0.2 relative error distribution function of students, who received the grades of 5 points and 4 points coincide.
3. When the error in measuring students’ knowledge tends to zero, the conditional probability of assimilating the material by students who receive a grade of 5 points on a five-point measurement scale (“1” on a dimensionless scale), increases and tends to one, while the conditional probabilities of assimilating the material of an academic discipline by students, who receive grades of 4 and 3, 2 and 1 points (0.8 and 0.6, 0.4 and 0.2 grades on a dimensionless scale), decreases and tends to 0.6 and zero, respectively.
Библиографическая ссылка
Романов В.П., Ширяева Н.А. THE INFLUENCE OF THE MEASUREMENT ERROR OF THE STUDENT’S KNOWLEDGE ASSESSMENT ON MODELING THE DISTRIBUTION FUNCTION IDENTIFYING HIM IN THE PROCESS OF ASSIMILATING KNOWLEDGE // European Journal of Natural History. 2021. № 2. ;URL: https://world-science.ru/en/article/view?id=34162 (дата обращения: 22.07.2026).