
Scientific journal
European Journal of Natural History
ISSN 2073-4972
ИФ РИНЦ = 0.204
CYBER COVID 19 EXPANSION SIMULATION

Coronaviruses are a family of RNA-containing viruses, united into two subfamilies that infect humans and animals [1]. For the first time, identified at the end of 2019, the enveloped single-stranded RNA (+) virus SARS-CoV-2 and causing a dangerous infectious disease – COVID-19, is a representative of beta coronaviruses. SARS-CoV-2 caused a pandemic that quickly frolicked around the world in early 2020. The World Health Organization has called the situation a global health emergency [2].
The reproduction index, according to various Centers for Disease Control, ranges between 2 and 5.47. Reproduction index is a dimensionless parameter characterizing the infectiousness of an infectious disease in epidemiology. It is determined by the number of people who will be infected by carriers of the disease who have entered a completely unimmunized environment and in the absence of special epidemiological measures aimed at preventing it (for example, quarantine). If the value is greater than 1, then at the initial stage the number of cases will grow exponentially [3].
The virus was first officially reported in a patient with pneumonia in Wuhan, Hubei province, China. On December 31, 2019, the world health organization was notified of the new virus, which declared the epidemic a pandemic on March 11. At the moment, the origin of the virus is not fully understood, but it is assumed that this is a mutation of the bat coronavirus and, possibly, another type of virus. This virus is zooanthroponous. That is, the disease caused by it is common for humans and animals [4].
To date, the number of sick people continues to grow. Since the formation of collective immunity is necessary to arrest the disease, the measures taken to prevent the growth of sick people are primarily aimed not at reducing the number of sick people, but at stabilizing its growth in moderate amounts to relieve the health systems of countries [5]. The number of deaths in the world from the SARS-CoV-2 coronavirus by May 18, 2020 amounted to 16 % of those who had been ill and 6.6 % of those who were diagnosed, the daily mortality rate was 6.9 % of those who had been ill (in Russia, respectively, 3.7 % from those who had recovered and 0.9 % of the detected infected and 3.2 % per day from those who had recovered).
At risk are people of the older age group, people with chronic diseases such as diabetes mellitus, cancer and others with a lowered immune response and drug users. The ways of transmission of infection are more often the following ways: “unwashed hands”, airborne droplets, fecal-oral, infected blood [6, 7]. Infection can occur both in the form of mild ARVI and complications in a severe form: pneumonia or respiratory failure with high mortality. In most people, the disease ends with recovery, without the use of specific therapeutic measures, while observing measures of isolation and body hygiene.
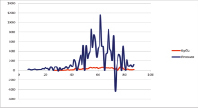
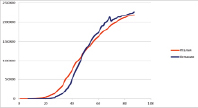
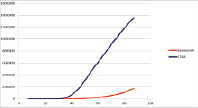
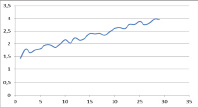
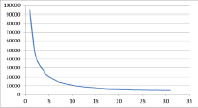
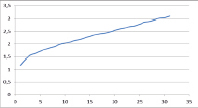
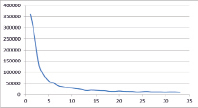
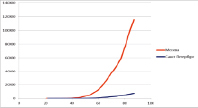
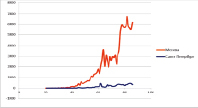
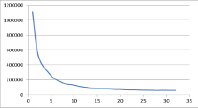
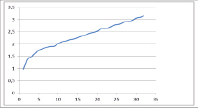
To date (May 2020), 52,200 papers have been published in the world in 2020 and 5,800 in 2019, dedicated to the problem of combating the new coronavirus infection. The weekly dynamics of articles starting from January 2020 is shown in Figure 1. As you can see, the graph corresponds to the life cycle curve of Gartner’s expectations.
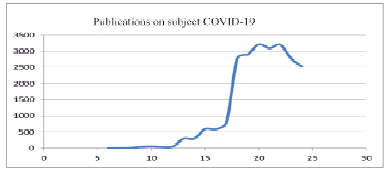
Fig. 1. Weekly dynamics of articles in scientific magazines on subject “COVID 19”
Meanwhile, modeling of the spread of infection has not previously been considered in scientific publications from a cybernetic point of view. Most of the scientific and practical research is devoted to the issues of modeling the economic and social consequences of a pandemic. For example, one of the attempts to use artificial intelligence to predict the spread of a pandemic is presented on the portal https://nnov.hse.ru/news/357790402.html (the model includes 19 differential equations, the accuracy of the short-term forecast was 2.5 %).
Each country has its own characteristics: biogeographic, population, sociological, ethical, genetic, state, etc. Therefore, the pilot modeling of the course of a pandemic in various countries from the standpoint of cybernetics makes it possible to optimize the formation of management measures for the organization of predictive preventive measures.
Objective of the study: to help improve the quality of predicting the spread of COVID 19 at the initial stage by forming hypotheses characterizing the dynamics of the spread.
The research used the following methods: content analysis of open information sources, spectral analysis, methods of the theory of automatic control.
For this, at the stage of pilot modeling, it is required to evaluate such aspects of the ongoing process (cybernetic approach) as: stability of the system (propagation), analysis of amplitude and phase spectral characteristics, model of generating impulse action.
The essence of the cybernetic approach boils down to the following: let there be some “black box” (geographic region, landscape). The input of the “box” receives some influence, which causes a certain transient process – the “output of the box”, reflecting the dynamics of the spread of the disease (in this case, the number of people infected with the virus in the region).
In work [8], for example, the model of the impact on the “black box” by a rectangular impulse is considered, but it is not proved what justifies this particular form of impact. We propose to put forward hypotheses about the form of the generating effect based on the analysis of the spectral functions of the dynamics of the development of infection in the human population.
In [9] stochastic models are considered without substantiating this choice. Methods for analyzing the dynamics of various diseases at the regional level are presented in [10].
We propose a cybernetic approach because it:
– firstly, it allows to evaluate the shape and characteristics of the input action by the behavior of the transient response (output action);
– secondly, this approach is closely related to the synergistic research methodology and system analysis.
For this, at the stage of pilot modeling, such cybernetically characteristics of the ongoing process as: stability of the system (in different countries of the World), amplitude and phase parameters of the Fourier spectrum, and the model of the generating impulse action were evaluated.
The data for the pilot correlation analysis was formed on the basis of the information presented on the website https://index.minfin.com.ua/ reference/ coronavirus/geography/.
For a comparative analysis, the states were combined into groups: Island (Cuba, Great Britain, Japan) – group 1; European (Mediterranean – Italy, Spain) – group 2; American continents (USA, Brazil) – group 3; African countries (at opposite ends of the continent – South Africa, Egypt, Cameroon) – group 4; representatives of the post-Soviet space with different ideology and geographic characteristics (Republic of Belarus and Georgia) – group 5; representatives of large megapoles in Russia (Moscow, St. Petersburg) – group 6.
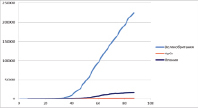
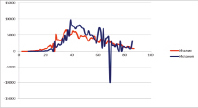
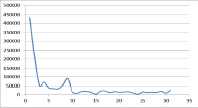
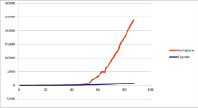
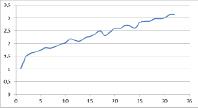
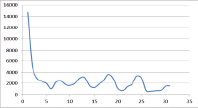
a) Infa b) Infd
c) Infa d) Infd)
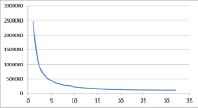
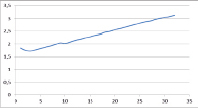
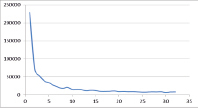
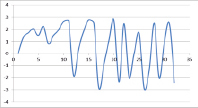
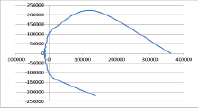
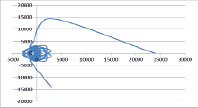
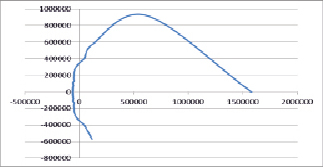
e) amplitude and phase Fourier spectra (UK)
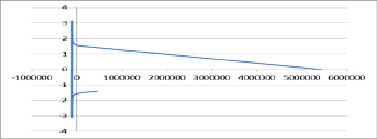
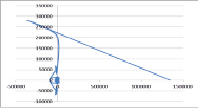
f) hodograph (Japan)
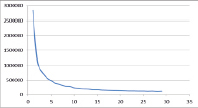
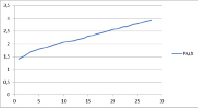
Fig. 2. Dynamics and distribution spectrum of coronavirus group 1
Results of a research and their discussion
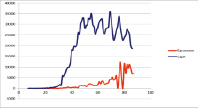
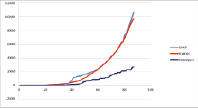
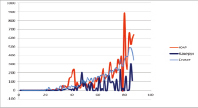
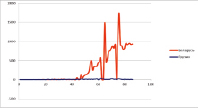
Figures 2-7 show graphs showing the dynamics of the development of the pandemic in these groups (and other characteristics). The virus spreads between people and the rate of its spread (the number of detected cases of infection) is determined not so much by the population of countries as by the population density, which largely determines the Rt indicator – the coefficient of infection spread (the average number of people that one patient infects before isolation). Therefore, the graph shows absolute values, not relative ones. All graphs are presented in two forms: the number of detected infected per day (Infd) and the cumulative effect (Infa). Monitoring range from 15.02.2020 to 12.05.2020.
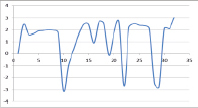
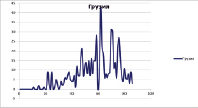
A) Infa B) Infd
C) amplitude and phase Fourier spectra (Italy)
D) hodograph (Italy)
Fig. 3. Dynamics and distribution spectrum of coronavirus group 2
A) Infa B) Infd
C1) amplitude and phase Fourier spectra Infa (USA)
C2) amplitude and phase Fourier spectra Infd (USA)
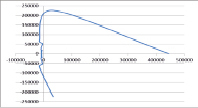
D) hodographs Infa and Infd (USA)
Fig. 4. Dynamics and spectrum spread of coronavirus group 3
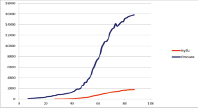
A) Infa B) Infd
C) amplitude and phase Fourier spectra (Egypt)
Fig. 5. Dynamics and spread of coronavirus group 4
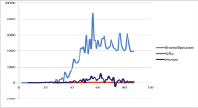
A) Infa B1) Infd
B2) Infd
Fig. 6. Dynamics and distribution spectrum of coronavirus group 5
D1) amplitude and phase Fourier spectra Infa (Republic of Belarus)
Г2) amplitude and phase Fourier spectra Infd (Republic of Belarus)
D) amplitude and phase Fourier spectra Infa and Infd (Republic of Belarus)
Fig. 6. Dynamics and distribution spectrum of coronavirus group 5
A) Infa B) Infd
Fig. 7. Dynamics and spectrum spread of coronavirus group 6
C) amplitude and phase Fourier spectra (Moscow)
D) hodograph (Moscow)
Fig. 7. Dynamics and spectrum spread of coronavirus group 6
Conclusions
A pilot analysis of the results of the studies presented in the figures leads to the following conclusions:
1. In terms of distribution – the smaller the territory, the less the distribution (that is, not only the population density, but also the size of the territory where the infection is spread is decisive). Indeed, a person’s contacts do not depend on density – if it is not living in a confined space, but on society – that is, with whom, when and how, a sick person can contact. Analysis of the phase spectral function and hodograph allow us to assume the stability of the cybernetic system that caused and determines the spread of the disease.
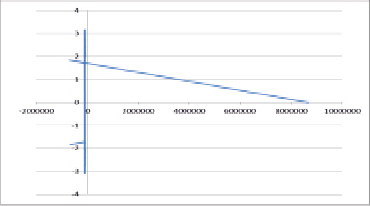
2. The amplitude function of the Fourier frequency spectrum of the spread of the disease resembles a reaction to a bell-shaped pulse generating function: 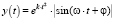 . The reaction to this effect allows us to assume periodically arising “waves” of the spread of the incidence with a certain period with attenuation in each cycle by a multiple of e = 2.7. The period of spread and frequency are determined by the resonant frequency of the “life cycle” of the virus and population immunity of the population in a certain area and the power of population immunity, respectively. Note that an artificial increase in the latter can lead to an increase in the number of allergic diseases.
3. The hodographs of the spectral functions the spread of morbidity show that the characteristic polynomial of the transfer function of the hypothetical response system has the second degree.
4. To destabilize the stable spread of an infectious disease, it is necessary to introduce a positive feedback loop (or other corrective links). These links are preventive and therapeutic measures, regulated by administrative measures and “traditional medicine”. The absence of such feedback will lead to attenuation of the process spreading the virus along a bell-shaped exponential, but the resistance will not be destroyed (which is unfavorable in this case).
The this applied research technique can be useful for modeling the spread of various infectious diseases.
Библиографическая ссылка
Кирюткин М.В., Артеменко М.В., Салиева М.Д. CYBER COVID 19 EXPANSION SIMULATION // European Journal of Natural History. 2020. № 6. ;URL: https://world-science.ru/en/article/view?id=34133 (дата обращения: 02.08.2026).