The primary production of ecosystems is its most important characteristic, the assessment of free energy, which ensures the flow of the biological cycle.
Above-ground and underground phytomass is an integral part of the structure of the plant community, reflecting the quantitative ratio of phytocenosis species. Quantitative relations of aboveground and underground phytomass allow to establish the level of loads on the studied communities, to determine the degree of their degradation, to trace the features of the process restoration of steppe vegetation. Changes in the productivity of steppe communities were studied on two key areas in Pricelessly lowland.
Knowledge of this value is necessary both for understanding the functioning of phytocenoses and for assessing their production potential. These data reflect fluctuations and features of production and destruction processes in steppe phytocenoses with different modes of existence, as well as the direction of ecosystem development for the region [2]. Quantitative study of community plants allows to reveal fluctuations and succession of vegetation cover, which is important for background monitoring observations in connection with the problem of restoration of vegetation cover of the Prisulak lowland. Productivity indicators can also be characterized as links in the succession series, each of which represents a particular stage in the change of vegetation cover. Negative climate change and unsustainable use of natural resources cause varying degrees of transformation of ecosystems, degradation of soil and the digression of vegetation cover and, as a consequence, reduction bioproductive and economic potential of agricultural and pastoral lands. This is especially true of regions located in natural areas with arid climate, in particular, such as the steppe ecosystems of Dagestan.
Materials and methods of research
A comparative analysis of the structure and functioning of cenoses on the basis of comparing the dynamics of stocks and the nature of biomass flows.
Object of study: natural cenosis.
1) Plot Pricelessly lowlands in the vicinities of Makhachkala (the district of the village of Shamkhal). The nature of vegetation mixed Artemisia taurica , elytrigia repens association, soil type-meadow (table 1).
2) Plot Prisulakskoyi lowland in the vicinity of the village Krasnoarmeysky, the nature of vegetation – artemisia vulgaris, elytrigia repensassociation, soil type-chestnut. The vegetation cover is shown in table 1.
The purpose and objective of the study are:
– comparative analysis of the structure and functioning of cenoses on the basis of comparing the dynamics of stocks and the nature of organic matter flows in the “soil-plant” system.
When sampling the soil used the generally accepted by method Arinushkina [1]. We have considered methods for collecting field material Titlyanova A.A. [9–11], Gordeeva T.K. [2]. Underground biomass was determined by the method of monoliths of Shalyt M.S. [12].
Research time 2014-2016 years. Collection of field material, its processing, analysis of samples of fractions of plant matter.
Results of research and their discussion
Includes data about dynamics of stocks of the substance in blocks (in the case of measuring only reserves) and data on the dynamics of stocks and flows of intensities (in the case of measuring those and others). To build a balance of elements of mineral nutrition, we calculated the value of pure primary products, the intensity of decomposition in different fractions of plants. The material was collected monthly during the growing season and was timed to the main phases of development of winter wheat:
1) tillering;
2) pipe-forging;
3) flowering (earing);
4) fruit formation;
5) milk-wax ripeness;
6) full ripeness.
Table 1
Change of plant community in natural cenoses
|
Selection time |
Natural coenosis, № 1, soil-meadow |
Natural coenosis, № 2, soil-chestnut |
|
May |
cardaria draba, hieracium pilosella, anthemis ruthenica, aegilops cylindrica, carduus acanthoides. |
trifoliumcampestre, anthemis ruthenica, bromus mollis, artemisia taurica, achillea micrantha willd, juncus effuses |
|
June |
euphorbiaceae, inula britannica, lotus corniculatus, helmin- thotheca echioides, elytrigia repens (dominatum imponere), trifolium repens, potentilla |
artemisia taurica willd (dominatum imponere) seseli tortuosum, alhagi, (dominatum imponere) |
|
July |
elytrigia repens, trifolium repens, potentilla |
alhagi, artemisia taurica willd |
Table 2
Dynamics of plant matter in natural steppe cenosis (site 1 – meadow, site 2 chestnut) g/m2
|
Period |
sites |
aboveground mass |
living roots |
mortmass |
rags |
litter |
plant litter |
|
April |
1 |
101,9 |
215,6 |
94,8 |
19,8 |
||
|
2 |
133,2 |
560,3 |
350,1 |
140,1 |
|||
|
May |
1 |
175,4 |
353,8 |
245,6 |
50,1 |
76,1 |
|
|
2 |
207,5 |
700,7 |
601,3 |
59,3 |
76,1 |
||
|
June |
1 |
330,0 |
421,9 |
314,1 |
18,4 |
||
|
2 |
296,4 |
333,1 |
441,4 |
79,9 |
|||
|
July |
1 |
640,0 |
229,2 |
52,7 |
8,3 |
||
|
2 |
365,0 |
219,0 |
56,6 |
105,9 |
11,4 |
||
|
August |
1 |
23,6 |
54,9 |
39,8 |
95,3 |
99,3 |
139,8 |
|
2 |
94,4 |
560,3 |
250,1 |
148,1 |
48,4 |
64,6 |
|
|
September |
1 |
169,6 |
429,5 |
102,6 |
85,4 |
18,8 |
|
|
2 |
483,0 |
392,5 |
285,8 |
125,6 |
31,9 |

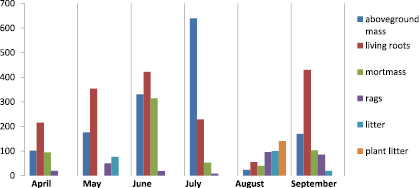
Fig. 1. Site № 1 (meadow soil) g/m2

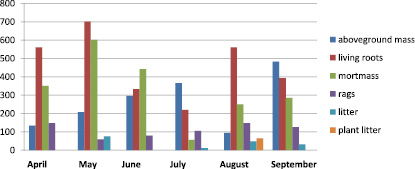
Fig. 2. Site № 2 (chestnut soil) g /m2
The following fractions of phytomass were distinguished: aboveground: stems, leaves, flowers, grain , living roots, rags (dead, but not yet fallen parts of plants ), trifle and mortmass ( crushed aboveground biomass), undecayed or semi-decayed straw, litter, seeds. Litter was not taken into account separately, as it was found on the soil almost only at the time of harvest. The timing of sampling is conventionally designated (period). The plants were cut to the level with the soil, all the mowing was done at the beginning of the day. Underground biomass was determined by monolith method [1, 4, 7]. The dynamics of plant matter in the steppe cenosis (site 1) on meadow soil and (site 2) on chestnut soil is shown in table 2. Fig. 1. Fig. 2.
The structure and stocks of plant matter reflect both the differences in ecosystems and the relationship to changes in spatial distribution on the landscape profile. Large reserves of phytomass indicate a high intensity of the production process, the accumulation of mortmass (plant litter + litter) – a low rate of destruction.
The quantitative ratio of species and phytomass stock in plant annually accumulating dead remains is determined by the number of undecayed dead remains of previous years, the value of the green part of the above-ground mass, which died by autumn and forms a litter, remaining in the autumn at the root of the green parts of plants that died during the winter and spring of the next year [6].
Allocated in the phytomass of cuts of biography can be considered as elementary structural units in the overall plant mass, which bear a functional load, and the ratio and the weight indicators are markers of the seasonal dynamics of production and destruction processes of vegetation cover of the steppes Pricelessly lowland. Productivity indicators can also be characterized as links in the succession series, each of which represents a particular stage in the change of vegetation. These data reflect the fluctuations and features of the production and destruction processes in the steppe phytocenoses with different modes of existence, as well as the direction of ecosystem development for the region. Quantitative study of community plants allows to identify fluctuations and succession of vegetation, which is important for background monitoring observations in connection with the problem of restoration of vegetation cover.
It should be noted that the number of primary products of each phytocenosis depends both on the meteorological conditions of the year and on the biological characteristics of the species that make up this community. Quantitative expressions of the total value of the plant mass of the studied communities and the relationship between its individual components, as well as the course, pace, rhythm of formation and destruction are determined by the biological and morphological features of the components of the vegetation cover [4].
Chestnut soils are the main type of soil in the dry steppe zone. With a humus content of 2.17 %. The content of total nitrogen 0,15-0,20 %, hydrolyzed nitrogen 3,0-6,0 mg/100 g of soil; total phosphorus 0,12-0,18 mg, mobile phosphorus 2,0-2,5 mg; total potassium 1,2-2.mg, exchangeable potassium 30-70 mg /100 g of soil. The simultaneous manifestation of salinization and weakly expressed intra-soil clay formation emphasize the regional specificity of chestnut soils of Dagestan [8].
For the meadow soil typical of clear differentiation of the horizons, a significant humus horizon, carbonate content, well expressed fine lumpy-granular structure, excessive moisture of the lower layers. These soils are characterized by hydrogenic accumulation of carbonates, gypsum, salts and horizontal stratification. Humus content in meadow soils 4-7 %. According to the content of soil nutrients are included in the group of medium-hydrolyzed nitrogen 38.1-39.9 mg/100g of soil and below the average phosphorus 1.0-2.0 mg/100g of soil, exchangeable potassium 25-30 mg/100g of soil [3, 5].
Based on the results of the study, the following conclusions can be drawn:
The highest value of plant matter is determined on meadow soil: above-ground biomass in July – 640,0 g/m2, roots in September – 429,5 g/m2, mort mass in June – 314,1 g/m2, rags in August – 95,3 g/m2 . The minimum values were determined in August-biomass – 23.6 g/m2, roots – 54.96 g/m2, mortmassy – 39.8 g/m2 and rags in July – 8.3 g/m2.
On chestnut soil (site 2) above-ground biomass reaches its maximum in September 483,0 g/m2, in May, the roots 700,7 g/m2, and mortmass – 441,4 g/m2 and a rag in August – 148,1 g/m2 Minimum value of biomass was determined in August of 94.4 g/m2, in July, the roots -219,0 g/m2 and mortmass – 56.6 g/m2 and a rag in May of 59.3 g/m2.
Conclusions
Comparing the above-ground productivity of communities over the study period
it can be concluded that the restoration of natural vegetation on sites is not always with an increase in productivity communities. During this period, a significant increase can be noted only on one of the sites. The second sites are characterized by significant (to some extent) drop in productivity plant community.
Analysis of the production and destruction process in the studied areas showed that in meadow soil the value of above-ground biomass is greater than in chestnut. The value of the reserves of the root system, mortmass and rags more on chestnut soil than in the meadow.
The primary production of ecosystems is the most important characteristic, the assessment of free energy, which ensures the flow of the biological cycle. Knowledge of this value is necessary both for understanding the functioning of phytocenoses and for assessing their production potential.
Biological circulation of substances or metabolic processes between plants and soil, serve as the basis for the management of biological productivity of natural and agricultural biogeocenoses, preservation of public health, improve soil fertility and animal productivity, environmental quality control.

