
Scientific journal
European Journal of Natural History
ISSN 2073-4972
ИФ РИНЦ = 0.204
INVESTMENT POTENTIAL EVALUATION ON THE BASIS OF REGION COMPETITIVE ADVANTAGES IDENTIFICATION FOR THE PURPOSE OF FOREIGN INVESTORS’ ATTRACTION

Investment attractiveness forming is the priority direction of the regional economy development ensuring capital raising and stimulating its social and economic development. The basic element of the region investment attractiveness management is the evaluation of investment potential existing level and its comparison with close regions for the purpose of competitive advantages identification and proper investment policy elaboration.
The author’s research of foreign countries regions investment attractiveness and practical experience of investments attraction in Russia proves that foreign investors take apprehensively the regions with medium or low investment attractiveness. The region investment attractiveness can be managed but it needs a serious approach to the question of the existing potential: that is industrial, infrastructure, financial, labor, touristic etc. The directions of its effective use for investors attraction can be carried out only after all its components analysis and its importance in the regional economy development evaluation. That’s why the investment potential evaluation as the basis of the region investment image forming and investment strategy development is so important for the region.
The regional investment potential is the cumulative ability of the region own and borrowed resources to provide the investment activity with the presence of favourable investment climate for the purposes and in scales determined by the regional economic policy [1]. The study of native and foreign literature devoted to the problems of regions investment image forming and generalization of the researches in this area allowed the authors to offer the following algorithm of the region investment potential evaluation:
1. The definition of the objectives of the investment potential evaluation (it can be: studying of investment potential separate components, identification of potential underutilized opportunities, region development strategy correction, searching of the new ways of investment image forming etc.).
2. The selection of the regional investment potential evaluation methodology. The Rating Agency “Expert RA” [8], The Council under the Russian Federation Ministry of Economic development and Russian academy of sciences for the studying of productive forces [6], The National Rating Agency (NRA) [7], The Agency for strategic initiatives [5] research and evaluate the Russian regions investment attractiveness.
3. Necessary evaluation information receipt. The data of the Rating Agencies, Federal state statistics service, the investment regional portals etc. can be the information sources.
4. The regional investment potential evaluation by means of the chosen methodology. The obtained evaluation results processing.
5. The use of evaluation data for the purpose of taking management decision on the region investment attractiveness forming, the development strategy carrying out on the basis of the new investment image forming.
The authors offer the investment potential evaluation complex methodology based on the regions competitive advantages identifying (fig. 1). The methodology is based on the scientific approach, reliable statistical indicators, rating agencies analytical data. The results of the investment potential evaluation methodology based on competitive advantages allow to form the region investment image using private potentials and to search actively the directions of the potential unformed separate subspecies development.
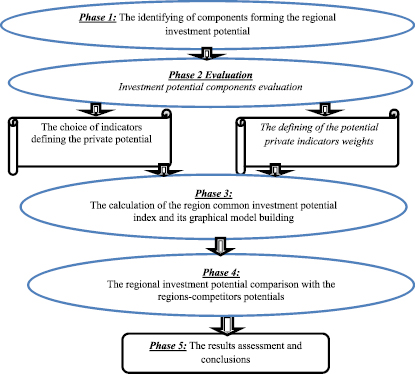
Fig. 1. Regional investment potential evaluation complex methodology
Let’s consider this phases in more detail.
Phase 1. We will consider the regional investment potential through the potentials which forming it, that is: industrial, labor, consumer, infrastructural, financial, innovative, natural and touristic.
Phase 2. Into the composition of the private indicators used for regional investment potential identification such potentials as industrial, labor, consumer, infrastructural, financial, innovative, natural and touristic are included (presented in the table 1).
The numeric value of each indicator presented in the table 1 is calculated with the use of the following formula:
 (1)
(1)
where P is the calculated private potential indicator,
pc – the index value in the region evaluated,
pmax – the maximum value among all regions.
On the third phase the calculation of region total investment potential is carried out and its graphical model building is implemented. For this purpose the each potential indicators are summed and then they are divided on the amount of the indicators of presented private potential and at least the sum received is multiplied by the potential weight (formula 2):
 (2)
(2)
where I is the potential calculated;
n – the number of indicators in the potential;
pi,j – j indicator i potential;
di – the weight of i potential, percentage.
For the purpose of private indicators weights determination let’s use the “Expert RA” Rating Agency data [8]:
– industrial potential – 0,7;
– labor potential – 0,7;
– consumer potential – 0,65;
– infrastructural potential – 0,6;
– financial potential – 0,6;
– innovative potential – 0,4;
– natural resource potential – 0,35;
– touristic potential – 0,05.
Phase 4. The comparative analysis of the regions is necessary for the potential evaluation in the context of competitiveness and for separate region investment attractiveness gradation determination.
Let’s carry out the evaluation of the investment potential of the Ivanovo, Yaroslavl, Kostroma and Vladimir regions on the basis of the algorithm offered by the authors.
For the purpose of the Ivanovo, Yaroslavl, Kostroma and Vladimir regions investment potential evaluation eight potential subspecies in the dynamics from 2011 to 2016 were determined [2; 3; 4].
While analyzing the industrial potential data presented in the table 2 we can say that the highest values for the period from 2011 to 2016 the industrial potential achieved in Vladimir region, Yaroslavl region is following behind. The Ivanovo region industrial potential is lowest among all the regions considered.
Table 1
The indicators used for regional investment potential identification
|
1. Industrial potential: – GRP (gross regional product) per capita, amount in roubles – the number of industrial enterprises in the region, units |
|
2. Labor potential: – average number of economy employed people, thousands of people; – life expectancy, years; – professional and educational level, availability of education. |
|
3. Consumer potential: – actual final consumption of households per capita, amount in roubles; – the living area total area per capita per capita, square meters. |
|
4. Infrastructural potential: – operational length of Railways for General use, kilometers; – the density of public paved roads per 1000 square kilometers of territory, kilometers. |
|
5. Financial potential: – organizational activity balance financial result, millions of rubles; – the distribution of operating credit institutions, units. |
|
6. Innovative potential: – organizations carrying out the scientific researches and elaboration, units; – the volume of innovative goods, works and services, millions of rubles. |
|
7. Natural resource potential: – mining operations, millions of rubles; – the land agricultural area, thousands of hectares. |
|
8. Touristic potential: – the number of travel companies, units; – the annual tourist flow, number of people. |
Table 2
The regional industrial potential in the period from 2011 to 2016
|
Region |
Industrial potential, % |
||||||
|
2011 |
2012 |
2013 |
2014 |
2015 |
2016 |
The place among the regions evaluated |
|
|
Ivanovo region |
27,79 |
25,76 |
25,55 |
28,7 |
25,48 |
26,18 |
4 |
|
Yaroslavl region |
50,61 |
47,74 |
50,82 |
54,32 |
53,76 |
53,69 |
2 |
|
Kostroma region |
39,62 |
37,17 |
39,13 |
40,11 |
39,13 |
38,08 |
3 |
|
Vladimir region |
70 |
70 |
70 |
70 |
70 |
70 |
1 |
The labor potential data received are presented in the table 3. For all assessed regions a high value of this potential is witnessed. This circumstance suggests that a large part of the population is working age people with sufficient level of professional education.
The great importance for the region has the consumer potential because when choosing the investment territory the potential investor quite often pays attention exactly on this indicator.
It may be noticed that Yaroslavl region during the six years has maximum consumer potential (table 4). The Ivanovo region consumer potential is on the fourth place and gives way to Kostroma and Vladimir regions. The average level of the Ivanovo region consumer potential witnesses about the low aggregate purchasing power of the population which in its turn flows from the labor payment average level and population income per capita.
Let’s calculate the regional infrastructural potential (table 5). While business organization the highest level of the territory infrastructure preparation allows saving resources and making much profit compared to regions with worse prepared infrastructure.
Table 3
The regional labor potential in the period from 2011 to 2016
|
Region |
Labor potential, % |
||||||
|
2011 |
2012 |
2013 |
2014 |
2015 |
2016 |
The place among the regions evaluated |
|
|
Ivanovo region |
68,7 |
68,7 |
69,5 |
69,4 |
69,2 |
69,6 |
2 |
|
Yaroslavl region |
70 |
70 |
70 |
70 |
70 |
70 |
1 |
|
Kostroma region |
69,1 |
68,5 |
69,7 |
69,3 |
69,4 |
69,4 |
3 |
|
Vladimir region |
68,7 |
68,1 |
68,7 |
68,7 |
68,6 |
68,9 |
4 |
Table 4
The regional consumer potential in the period from 2011 to 2016
|
Region |
Consumer potential, % |
||||||
|
2011 |
2012 |
2013 |
2014 |
2015 |
2016 |
The place among the regions evaluated |
|
|
Ivanovo region |
57,6 |
57,8 |
59,4 |
59,7 |
59,0 |
58,1 |
4 |
|
Yaroslavl region |
64,2 |
63,9 |
63,3 |
63,9 |
63,3 |
63,6 |
1 |
|
Kostroma region |
62,3 |
60,9 |
59,7 |
59,9 |
58,2 |
59,6 |
3 |
|
Vladimir region |
60,7 |
60,60 |
62,2 |
61,9 |
61,7 |
61,8 |
2 |
Table 5
The regional infrastructural potential in the period from 2011 to 2016
|
Region |
The regional infrastructural potential, % |
The place among the regions evaluated |
|||||
|
2011 |
2012 |
2013 |
2014 |
2015 |
2016 |
||
|
Ivanovo region |
41,2 |
34,9 |
41,2 |
41,2 |
41,2 |
40,9 |
3 |
|
Yaroslavl region |
47,9 |
39,9 |
45,7 |
44,9 |
44,6 |
45,1 |
2 |
|
Kostroma region |
33,6 |
29,6 |
34,6 |
32,4 |
32,4 |
32,8 |
4 |
|
Vladimir region |
59,9 |
60 |
60 |
59,7 |
59,3 |
60 |
1 |
Table 6
The regional financial potential in the period from 2011 to 2016
|
Region |
Financial potential, % |
The place among the regions evaluated |
|||||
|
2011 |
2012 |
2013 |
2014 |
2015 |
2016 |
||
|
Ivanovo region |
11,3 |
25,4 |
28,1 |
22,1 |
27,4 |
27,3 |
4 |
|
Yaroslavl region |
45,2 |
39,5 |
52,8 |
40,9 |
21,5 |
29,7 |
3 |
|
Kostroma region |
21,1 |
26,4 |
30,9 |
32,7 |
35,3 |
33,5 |
2 |
|
Vladimir region |
39,0 |
42,9 |
42,9 |
42,9 |
45,0 |
45,0 |
1 |
The financial potential identification on the level of each region is the starting point in the carrying out of any consolidated program and development forecast. The financial potential of the region contains the financial resources available to the region, not only in the actual present, but also in the future, that is the resources that can be brought to the region development. The financial potential values by the regions in the dynamics are presented in the table 6.
The analysis showed that Vladimir region has the highest value of collection of financial and monetary resources which are necessary for sustainable economic activity maintaining. Ivanovo region takes the last place among the considered regions by the level of the financial potential.
Innovative potential is collection of innovative resources which provide the opportunity of innovative activity and innovative technology, production and service creation [10]. On the basis of the date presented in the table 7 it is clearly that Vladimir and Yaroslavl regions have the highest innovative potential.
The values of regional natural resource potential in dynamics are presented in the table 8. As of 2016 Vladimir region potential exceeds Ivanovo region potential in two times.
Table 7
The regional innovative potential in the period from 2011 to 2016
|
Region |
The regional innovative potential, % |
The place among the regions evaluated |
|||||
|
2011 |
2012 |
2013 |
2014 |
2015 |
2016 |
||
|
Ivanovo region |
34,5 |
13,3 |
12,8 |
13,0 |
13,9 |
11,7 |
3 |
|
Yaroslavl region |
37,1 |
37,0 |
38,8 |
38,4 |
40 |
33,4 |
2 |
|
Kostroma region |
5,9 |
5,8 |
5,6 |
6,5 |
6,5 |
5,8 |
4 |
|
Vladimir region |
21,2 |
35 |
34,4 |
34,7 |
33,7 |
34,4 |
1 |
Table 8
The regional natural resource potential in the period from 2011 to 2016, %
|
Region |
The natural resource potential, % |
||||||
|
2011 |
2012 |
2013 |
2014 |
2015 |
2016 |
The place among the regions evaluated |
|
|
Ivanovo region |
19,6 |
19,9 |
18,8 |
16,1 |
15,6 |
16,4 |
4 |
|
Yaroslavl region |
24,2 |
32,9 |
26,4 |
22,9 |
21,9 |
23,5 |
2 |
|
Kostroma region |
17,7 |
18,1 |
17,3 |
16,8 |
16,5 |
18,7 |
3 |
|
Vladimir region |
32,9 |
32,9 |
32,9 |
32,9 |
32,9 |
32,9 |
1 |
Table 9
The regional touristic potential in the period from 2011 to 2016, %
|
Region |
The regional touristic potential, % |
The place among the regions evaluated |
|||||
|
2011 |
2012 |
2013 |
2014 |
2015 |
2016 |
||
|
Ivanovo region |
4,3 |
3,5 |
3,2 |
2,9 |
3,32 |
3,3 |
2 |
|
Yaroslavl region |
3,1 |
2,8 |
2,7 |
2,7 |
2,6 |
2,8 |
3 |
|
Kostroma region |
2,8 |
2,3 |
2,1 |
1,7 |
1,8 |
2,1 |
4 |
|
Vladimir region |
5 |
5 |
5 |
5 |
5 |
5 |
1 |
Table 10
The common regional investment potential in the period from 2011 to 2016
|
Region |
Investment potential, % |
The place among the regions evaluated |
|||||
|
2011 |
2012 |
2013 |
2014 |
2015 |
2016 |
||
|
Ivanovo region |
264,99 |
249,26 |
258,55 |
253,1 |
255,1 |
253,48 |
4 |
|
Yaroslavl region |
342,31 |
333,74 |
350,52 |
338,02 |
317,66 |
321,79 |
2 |
|
Kostroma region |
252,12 |
248,77 |
259,03 |
259,41 |
259,23 |
259,98 |
3 |
|
Vladimir region |
357,4 |
374,5 |
376,1 |
375,8 |
376,2 |
378 |
1 |
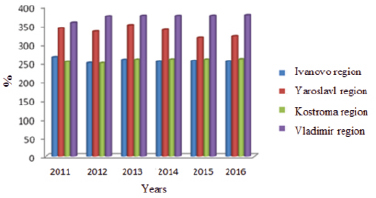
Fig. 2. The regional investment potential in the period from 2011 to 2016, %
The values of the touristic potential in dynamics are presented in the table 9. The touristic potential of all regions considered are at enough high level.
After calculation of all private potentials we can find out the investment potential common indicator of each of the researched regions. The data received are presented in the table 10.
For the purpose of a more visual image of the investment potential let’s build the diagram reflecting the quantitative indicators of the given data (fig. 2).
After analyzing the main indicators influencing on the regional investment potential the authors come to the conclusion that Vladimir and Yaroslavl regions take the leading positions by the investment potential level. Ivanovo and Kostroma regions investment potential take the medium place; moreover the dynamics stays stability throughout the analyzed period.
The investment potential management policy for the purpose of foreign investor attracting should be carried out correctly. It should be the region investment image forming with the use of competitive advantages and on those potential components focusing, where the region is the leader, and at the same time unformed private potential directions actively forming, maintaining and developing.
Библиографическая ссылка
Abramova E.A. INVESTMENT POTENTIAL EVALUATION ON THE BASIS OF REGION COMPETITIVE ADVANTAGES IDENTIFICATION FOR THE PURPOSE OF FOREIGN INVESTORS’ ATTRACTION // European Journal of Natural History. 2017. № 6. ;URL: https://world-science.ru/en/article/view?id=33812 (дата обращения: 07.05.2026).