
Scientific journal
European Journal of Natural History
ISSN 2073-4972
ИФ РИНЦ = 0.204
DYNAMICS OF FINLAND WOOD SQUARE

Introduction. On site http://metla.fi/ we fast have found statistical data [1, с. 51] on Fin-land wood square modification in a period of 1921-2007 years. The Finland wood statistics is rich by table models, for example in the wood program [2], and also always Q-factor of sampling is visible. However we anywhere have not found yet statistical models of dynamics, in particular, statistical models on such major landscape parameter as wood square. The biotechnical regularity examples are indicated in our books [3-6], and at that in the book [6] detailed examples on timber trade of Finland among 30 advanced countries are indicated. The mathematical modelling technology is indicated in study guide for the bachelors and magisters [7].
The article purpose - to show the biotechnical regularities of Finland wood square dy-namics in a period of 86 years, revealed by us, and also wave dynamics of oscillatory perturba-tion of the Finnish experts in wood management on an example [1, c.51]. On a ready model prognostic wood square dynamics is shown provided that in Finland the modern wood policy up to a 2100 will be continued without radical modifications. Earlier on data [8] the portrait of tim-ber this country trade [6] in a period of 1961-2005 years was composed.
Time scale. 1921 year is a beginning of coordinates t = 0 on an abscissa.
Two statistical numbers - on left t1 and right t2 time scale boundaries (table 1) on wood square S1 and S2 inclusive of different wood inventory periods were received.
If the wood parameter actualization was annual, with cyclicity of Earth rotation round the Sun one time scale would be natural.
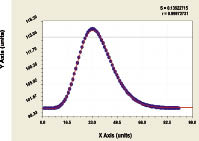
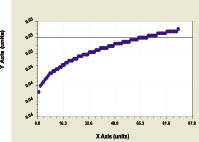
Wood grounds. All wood parameters are subjected identification by the biotechnical law [3-7] uniformly. Let´s show two ready models of a structural type S1=f(t1) and S2=f(t2) On two scales two models of 86-year´s Finland wood square dynamics (fig. 1) were obtained.
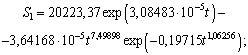 (1)
(1)
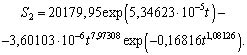 (2)
(2)
Table 1
Finland wood square dynamics
|
The code |
Period |
Time t, years |
Square, 103 ha |
||
|
t1 |
t2 |
S1 |
S2 |
||
|
VMI 10 - NFI 10 |
2004-07 |
83 |
86 |
20150 |
20150 |
|
VMI 9 - NFI 9 |
1996-2003 |
75 |
82 |
20338 |
20338 |
|
VMI 8 - NFI 8 |
1986-94 |
65 |
73 |
20074 |
20074 |
|
VMI 7 - NFI 7 |
1977-84 |
56 |
63 |
20065 |
20065 |
|
VMI 6 - NFI 6 |
1971-76 |
50 |
55 |
19738 |
19738 |
|
VMI 5 - NFI 5 |
1964-70 |
43 |
49 |
18697 |
18697 |
|
VMI 3 - NFI 3 |
1951-53 |
30 |
32 |
17352 |
17352 |
|
VMI 2 - NFI 2 |
1936-38 |
15 |
17 |
19580 |
19580 |
|
VMI 1 - NFI 1 |
1921-24 |
0 |
3 |
20138 |
20138 |
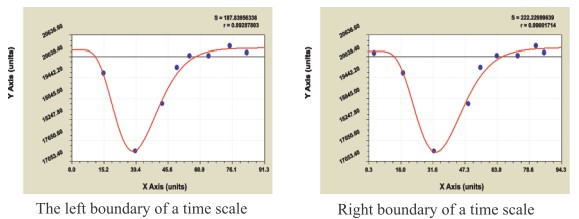
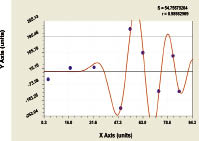
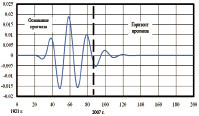
Fig. 1. Dynamics of Finland wood square in a period of 1921-2007 years (in a right upper angle the sum of squared deviations and formula correlation coefficient are shown)
The correlation coefficients are accordingly equal 0,9929 and 0,9900. For the further analysis we shall accept the formula (2), substituting tabulated model from data of table 1.
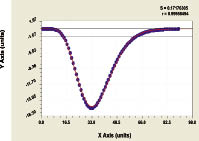
First component is the stable exponential growth law. At that this main trend shows ra-ther small growth on a comparison with the time scale beginning. And second component, with negative sign before itself, shows crisis excitation of national economy with 1925 on 2007 years and further in a period of 110 years.
Together schedules will show (fig. 2) possible scatters of data on a wood parameter.
The comparison of the schedules shows, that, since 2000 both scales begin to coincide. Therefore it is possible to make a conclusion that the national wood inventory have improved as the years go by. At that country has overcome territorial wood crisis.
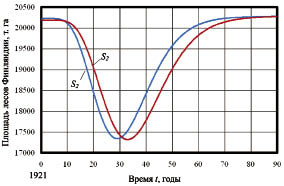
Fig. 2. Dynamics of wood square on taxation periods
From a fig. 1 it is visible, that there are points near schedules, that specifies on realized adaptability of the experts and population to wood square dynamics. Russia sharply differs in timber trade [6] from a fig. 2.
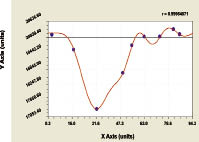
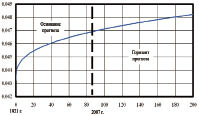
Crisis significance. The deal each component of a general trend (2) shows a significance of rather settlement wood square significances. The expressions ![]() and
and ![]() give from data of table 1 significance parameter dynamics (fig. 3):
give from data of table 1 significance parameter dynamics (fig. 3):
 (3)
(3)
 (4)
(4)
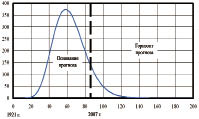
First component (2) Crisis component of model (2)
Fig. 3. Dynamics of significance coefficient of Finland wood square model (2) components
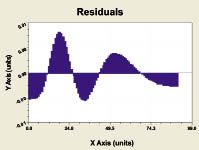
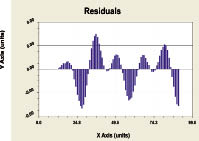
On a construction the models (3) and (4) are similar to a trend (2). Here both formulas were identified on settlement significances obtained on (2) in the software environments Excel. The residuals after (3) and (4) are indicated in a fig. 4, from which it is visible, that wave func-tion exists in addition to (2). Or else, not only crisis, realized by the Finns, but also natural oscil-latory wood square perturbation exist. Therefore, third component as a perturbation wave can be refered, apparently, to a wood behaviour.
Obviously, that the sum of significance coefficients of two components trend model (2) is equal 100%, that is ![]() .
.
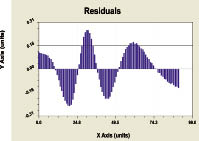
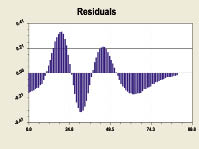
Residuals after the formula (3) Residuals after the formula (4)
Fig. 4. Dynamics of residuals from models of significance coefficient of model (2) components
Staff adaptability.
Significance coefficient k, for the formula (2) calculated as the relation k2/k1, ambassa-dor structural - parametrical identifications [7] has received (fig. 5) formula
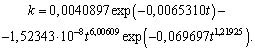 (5)
(5)
The more significance k in absolute magnitude, the activity of the given people popula-tion on use national natural riches becomes more intense. The negative sign shows crisis process. It will be stopped in Finland by a 2035 year.
The schedule of significance coefficient (5) Dynamics of residuals after a model (5)
Fig. 5. Dynamics of adaptability of the population and Finland wood economy to wood territory
The wave perturbation small and it coincides by time. The wood square in dynamics could be shown with high adequacy only on a trend (2). Though the oscillatory perturbation sig-nificance is small, however from a methodical view point wave perturbation has scientific and common sense. The oscillation can affect the future.
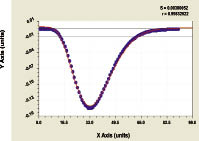
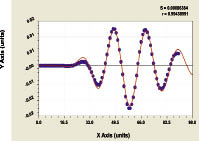
Wave perturbation. For the analysis of wave dynamics we shall accept a trend (2) S = S2 and on its residuals shall obtain the asymmetric wavelet-function [5, 6] (fig. 6а). And after joint parametrical identification we have received trinomial dynamics model:
S = S1 -S2 -S3 (6)
![]()
![]()
![]()
![]()
![]()
where S - square of woods of Finland for 86 years in dynamics in a period
of 1921-2007 years, t/ha;
S1 - stable wood square part in a period of wood measurements, t/ha;
S2 - critical wood square part in a period of 1925-2035 years. By a duration per 110 years a part of woods, т. Га;
S3 - oscillatory perturbation of woods on square, which is response to a behaviour of the people, t/ha;
A - amplitude half of wave perturbation of a wood as organism, t/ha;
p - half of variable period of oscillatory perturbation of a wood on square, years.
The period of oscillation in 1921 year was equal to 2⋅11,56241 ≈ 23,1 years or is approx-imately equal to two cycles of solar activity on Tchizhevsky effect [3-6]. In a period of 86 years the Finns have reduced in wood perturbation frequency increase, and this frequency in 2007 year was equal
to 1/(2⋅10,66) = 0,0469 year-1 and by a 2100 year the half cycle of wood perturbation will decrease to 10,41 years, that is all on 100⋅(11,56 - 10,41)/11,56 = 9,95%. The woods of Fin-land on square and in XXI century will change within the limits of the double cycle of solar ac-tivity till 2035 year. It means, that the interference of the Finns in life of the woods is ecological-ly responsible, and they reach an economic acceptability of wood exploitation at the expense of import of sticks [6].
Hereafter it is possible to conduct a component analysis for revealing a complex of bio-technical regularities of dynamics of woods on such parameters as geostatistical distribution of subcompartment, pfytocenosis elements, specific structure of wood trees, their age structure, vo-lumes of trunk timber, category of a sanitary state and other.
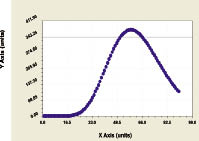
а) wave component of model (6) b) the schedule on all triadic model (6)
Fig. 6. Finland wood square dynamics in a period of 1921-2007 years
Though we have not found the publications under the wave wood theory of Finland and other countries, but the realized behaviour of the people, to begin with wood experts, in Finland is visible under the schedules in a fig. 6 as realized measures and outcomes in wood management.
Avareness of wood policy. The amplitude-frequency characteristic of wave component shows scientific validity forestry-based measures (fig. 7). Wood policy clearly preempts programs of timber trade, and it was visible 40 years back [2].
In the beginning XXI centuries the priorities of Finland were changed and timber trade has become active to develop. Experience of forestry management and, in particular, the reach-ings in wood statistics, can give new breathing to all wood economy sector of this wood country. In particular this experience will be useful to Russia.
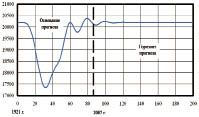
Wood management dynamism. Dynamism coefficient Kд is determined as the relation of the sum of a wave model component to a class of trend parts, that is not wave model compo-nents (6), that is on expression KД = S3 / (S1 - S2)
After identification the model (fig. of 8) of wood dynamism coefficient is obtained
![]() .
.
![]()
![]()
Amplitude of oscillatory perturbation of the Finnish woods Frequency of wave wood behaviour
Fig. 7. Dynamics of amplitude and frequency of Finland wood oscillation on square
Dynamism coefficient of the Finnish woods on (7) Residuals after a model (7)
Fig. 8. Dynamics of Finland wood square dynamism coefficient
The high adequacy to a model (7) allows to approve, that management of woods in Finland re-sults in stabilization using decrease of dynamism coefficient on wood square (table 2).
From the residual schedule in a fig. 8 it is visible, that the microwaves begin since 1933 year. However, the data of wood statistics on wood farms are necessary for their identification. Models (6) and (7) are high-precision within the limits of a Finland wood square measurement error.
Тable 2
Dynamism of Finland wood square
|
Years |
Time t, years |
Extremum Kд |
|
|
growth |
recession |
||
|
basis of the prognosis |
|||
|
1930 |
9 |
- |
0,00001 |
|
1940 |
19 |
0,00048 |
- |
|
1949 |
28 |
- |
0,00360 |
|
1959 |
38 |
0,00994 |
- |
|
1969 |
48 |
- |
0,01563 |
|
1980 |
59 |
0,01724 |
- |
|
1990 |
69 |
- |
0,01518 |
|
2000 |
79 |
0,01114 |
- |
|
Advance of the prognosis |
|||
|
2010 |
89 |
- |
0,00709 |
|
2021 |
100 |
0,00416 |
- |
|
2031 |
110 |
- |
0,00223 |
|
... |
... |
... |
... |
|
2078 |
157 |
- |
0,00001 |
In data of table 2 the maxima (wood square recession) and minima (parameter growth) under the schedule in a fig. 8 are indicated. Let´s remind that the wave perturbation in the formula (6) has negative sign. Therefore global minimum in a fig. 8 | K д max max | = 0,01724 shows a forest yield.
The half-cycle of dynamism coefficient have a remarkable property. They in time period of 1990-2010 years almost coincide with the solar activity cycle beginnings. Finnish foresters have managed actively to use Tchizhevsky effect on 23-th cycle of solar activity in a period of 1999-2009 years, most force from measured by the astronomers. Apparently, concurrence is not casual, and quite realized. System of wood statistics and data vsk 08_01 pdf help revelation this coincidence.
Prognostic model. Under the formulas (6) and (7), and also data of table 2, the cycle of modern wood policy of Finland on a wood square parameter will be finished in a 2078 year and will proceed 148 years. Dynamism coefficient is extremely small in relation to an allowable condition Kд ≤ 1. At that it the maximum significance of wave component in the formula (6) is equal to 1,84% for 1980 year, and zero significance is achieved by
2055 year.
Therefore for an evaluation macroeconomic parameters of a wood sector it is enough to accept trend of the formula (6) for drawing up prognostic model. In an outcome is received, that the 1921 year wood square level Finland will achieve by 2020 year. Hereafter national wood can qualitative be improved without square growth. But the dynamic numbers on other wood para-meters are necessary for the analysis.
Finland wood square forecasting. When model (6) adequacy with a coefficient of cor-relation 0,9996 (see fig. 6) is high it is quite possible to accept horizon of the prognosis equal to prognosis basis length. The basis is equal to 86 years, therefore under horizon of the prognosis also in a period of 86 years the limit of all time series per 192 years or per 1921 + 192 = 2113 years is received. The schedules in a fig. 9 and fig. 10 are constructed in a period of 200 years, that is till a 2121 year.
а) schedule on all triadic model (6) b) dynamism coefficient of wood on square
Fig. 9. Prognostic Finland wood square dynamics
Amplitude of oscillatory Finnish wood perturbation Frequency of a wave wood behaviour
Fig. 10. Prognostic dynamics of amplitude and frequency of Finland wood oscillation on square
Two variants prognostic models are possible: at first, by forecasting till a 2040 year all construction of a model (6) is accepted; secondly, since 2040 year it is possible to accept only equation
S = S1 = 20198,054 without second and third components.
Conclusions. It is possible to suppose, that on other parameters of Finland woods the sta-tistical models with high adequacy to appropriate dynamic numbers accepted from wood statis-tics of this country will determined.
On wood square dynamics we formulate the following main conclusions:
1) The territorial principle is precisely executed and recovery for 86 years with 1921 for a 2007 years specifies on that. At that rather small significance crisis trend and oscillatory compo-nents of dynamics model on wood square confirms excellence of long-term wood management;
2) Adaptability of Finland to the woods is very high, at that without high society tug, and the crisis on wood square was overcome on regularity of aperiodic oscillation;
3) Small on amplitude the wave perturbations will cease in the near future, though force the microoscillations will possible at a level of separate composite of wood farms; prognostic model shows an approximation of national wood square to constant significance, and it specifies high skill Finnish foresters, and their centenary wood management experience will be distributed and to other wood countries, including Russia;
4) For revealing a full limit of growth on square and other wood parameters it is necessary to conduct a component analysis in an annual mode and on other parameters all wood sub-compartments, and also to reveal biotechnical regularities of dynamics in geostatistical distribu-tions of country territory on land cadastre categories.
References
- Metsätilastollinen vuosikirja 2008 / vsk 08_01 pdf. - 82 p.
- Arvasti S. Forestry and wood industry in Finland in a period of
1970-2015 years / S. Arvasti, L. Heykinheymo, К. Кuusela. - Version № 9887. - Novosibirsk: GPNTB WITH АN USSR, 1982. - 106 p. - Mazurkin, P.М. Dynamics of manglings / P.М. Mazurkin, A.N. Bedertdinov, А.N. Fadeev. - Yoshcar-Ola: MarGTU, 2002. - 218 p.
- Mazurkin, P.М. Regularities of stable development / P.М. Nazurkin. - Yoshcar-Ola: MarGTU, 2002. - 302 sp.
- Mazurkin, P.М. A geoecology: regularities of modern natural sciences / P.М. Mazurkin. - Yoshcar-Ola: MarGTU, 2006. - 336 p.
- Mazurkin, P.М. Wood-agrarian Russia and world dynamics of wood exploitation / P.М. Mazurkin. - Yoshcar-Ola: MarGTU, 2007. - 334 p.
- Mazurkin, P.М. Mathematical modelling. Identification of one-factor statistical regularities: study guide / P.М. Mazurkin, A.S. Filonov. - Yoshcar-Ola: MarGTU, 2006. - 292 p.
- Food And Agriculture Organization Of The United Nation; The FAO Statistical Database; www.fao.org < http: // www.fao.org >; www.faostat.fao.org.
Библиографическая ссылка
Mazurkin P.M. DYNAMICS OF FINLAND WOOD SQUARE // European Journal of Natural History. 2010. № 6. ;URL: https://world-science.ru/en/article/view?id=21091 (дата обращения: 13.05.2026).