

Abbreviations/Acronyms used:
NCU – National Currency Units; rubbles – in case of Russia;
Rosstat – the Russian Statistical Service;
SNA – System of National Accounts (its 2008 version is implied by default);
PPP – purchasing power parity (for currency exchange rate).
In 2016, the authors have been commissioned to develop Guidelines and conduct experimental estimates for incorporating the value of national water resources into the National balance sheet in conformity with the SNA-2008 framework [1]. This work has been performed in furtherance of a parallel 2014 Rosstat project [2] to account for the value of Land resources on the National balance sheet in order to reflect more comprehensively the extent of the National wealth using SNA-2008 classification of asset classes. The outcome of this project was represented by Guidelines for valuation of water resources at current market prices through capitalization of water rent derived by the main water-using sectors of the economy. These Guidelines have been trial-tested on the basis of experimental macro-level estimates for the overall value of the national water resources, as well as exploring their applicability on the river-basin (i.e. “micro-level”) basis (with the respective value estimates/water accounts obtained for the Pechora, Don and Ob’ river basins). The Guidelines identify the requisite sources of input information and conclude with the algorithms for the proper recording of the value of the water resources, and the reconciliation of the annual changes therein, on the asset accounts and the national balance sheet.
The reported work follows the (to date) thin streak of international research on experimental SNA-related water account statistics in value terms centered on such jurisdictions as the United Kingdom ([3, 4], the United States [5], Netherlands [6] and Australia [7] [8]. As far as the treatment of Russian water resources for SNA purposes is concerned, it represents a pioneering initiative carried out according to the Rosstat WorkPlan.
Thus, it appears from published sources that water valuation accounts for SNAs purposes are available in the minority of jurisdictions – and even there still bear an experimental character – despite the fact that SNA 2008 framework for valuation of water resources is now almost a decade old. This Paper is an attempt to contribute yet another such experimental water valuation exercise to the above-mentioned pioneering body of research – in furtherance of the statistical aims of SNA-2008 as far as accounting for water resources is concerned.
Since in the Russian jurisdiction large surface water bodies (and underground water) are deemed to be officially held in sole ownership of the State (with an exception of minor water bodies, such as ponds, which are located inside private parcels of land), this circumstance, in a sense, much simplifies the accounting for national water resources on assets accounts – i.e. there is no need of allowing for intersectoral division of water ownership and, in line with p. 13.3 of SNA 2008 (which only, if at all, allows for a separation of economic and legal ownership of a natural resource when the resource usage/extraction rights akin to financial leasing arrangements are in evidence), all water is attributed to its titular owner – the State. This institutional matter, therefore, obviates the need for maintaining the capital-transactions-with-water-resources account and enables to attribute the entire derived water resource valuations to the “public sector”.
On the other hand, the complicating factor is that, unlike in the US and Australia, there is no market mechanism for water rights pricing whatsoever instituted in the Russian jurisdiction which would have created and registered market prices for transactions with marginal units of water resources. Whichever water usage rights endowments are in place (i.e. artesian water abstraction rights, waterways and ponds abstraction quotas) – even though since 2006 they are increasingly being based on negotiated bilateral contracts with the Federal Water Authority, as far as abstractions from waterways and surface water bodies is concerned – their price-setting is based on totally non-market related principles, i.e. a mandated tax-like levy which usually is a flat-scale one and insensitive to amounts, and variations in, economic rent generated by abstracted water resources. Therefore, akin to the approach pursued in other jurisdictions where water rights are not market-priced, the lack of market valuations for marginal transactions with water resources has necessitated the reliance on the deductive (residual) procedure of resource (water) rent capitalization, which is usually considered a default procedure of first recourse in instances where no market derived valuations are available (i.e. see [6, 7]).
The resource rent capitalization procedure has a long history of practical applications since early on in 20th century and is intended to value natural/water resources in a wide variety of contexts – from an analysis of public investment projects and resource taxation to now, increasingly, SNA-related valuation purposes.
The standard reference textbook on water valuation in investment and public policy domains [9] places water rent capitalization techniques as one of the principal varieties of the Residual method for water valuation – to first estimate and then capitalize “economic rents” derivable by industrial water resource users. The method commends itself for its simplicity as one
“that satisfies many needs for private and public evaluation of proposed water policies: a single surrogate shadow price or WTP [Willingness-to-pay] per unit of water that is comparable to and commensurate with prices observed for other goods and services in the economy” [9, p. 90–91].
On the other hand, the limitations of economic rent estimates for industrial users as applied to water resource valuations are inherently associated with the often arbitrary and uncertain nature of intermediate-input capital charges making the method very sensitive to assumptions and errors of omission in this regard and, therefore, often biased towards overstating the value of water resources.
While in other applications this water rent capitalization technique may be applied on the level of individual enterprises, or be specific only to regions affected by water investment projects under consideration, the SNA-related valuation analysis makes it necessary to apply the technique on the highest (most aggregated) level of industry analysis – with all the attendant issues associated with contamination of rents data by inputs from “collateral (i.e. non industry-specific) activities” of enterprises included in the industry groupings analyzed.
Nonetheless, SNA 2008 mandates that valuation of water resources for asset accounts should be conducted on the basis of general asset valuation principles (including those for mineral resource valuations) provided in SNA [1, pp. 13.16-13.25], but mentioning that other more practicable alternative approaches may also be utilized – such as sole reliance on the capitalization of water use/abstraction charges levied by the titular owner (the state) absent the better estimates [1, p. А3.85]. However, in SNA there is a putative hierarchy of approaches lined in the continuum of their “market-orientedness”. That is, similar to international accounting measurements under IFRS (e.g. the International Financial Reporting Standard 13 “Fair Value Measurements”), the mentioned SNA asset valuation principles prioritize the use of observable market data on resource prices where those are abundant enough (i.e. the pursuance of the market approach to resource valuation), but also – as a “second-best” option status-- permit the use of the cost approach techniques (which, in unrefined form, are mostly relevant to produced assets only), as well as income approach methods (the Net present value method (NPV), which is the workhorse of mineral resource valuations, and associated capitalization techniques) – where direct market price comparisons to infer the resource value are in thin supply.
Further – to condition the application of those approaches – an important SNA principle is that natural resources, including water, should be valued at their in-situ value – that is in “as is” condition, but not in some refined state for which their prices are indeed most often available. Thus, in line with other strictures on the application of “benefit transfers”, this suffices to show that the value of, say, tap water (or other destination use estimate) can’t be taken to immediately represent the value of a water resource in its “raw state” as found “at source”.
But given the absence of market-based raw-state pricing for water resources in Russia, falling back on the capitalization of water rent as a version of the residual (net present value -style) method of valuation is immediately self-suggestive – also given the respective precedents for the choice of this method for SNA valuation purposes in Netherlands, UK and Australia, e.g. even in those jurisdictions where water- resource pricing is more responsive to market signals and raw-water markets actually exist (i.e. in Australia). A variety of the cost approach – i.e. the least costs method – has also been considered by us and applied in the instance of one important water-reliant industry (hydroelectricity generation) as a back-up method to corroborate estimates obtained through water rent capitalization. On the other hand, it is a well-known lapse of the rent capitalization techniques that, where the estimated rents they return are zero- or negative- valued, the method itself ceases to be useful (since water value is bounded at zero and, being a public asset, can’t be negative- valued). In such instances, we believe that negative industry-wide rents indicate that resource fails to generate any rent and should therefore be zero-valued in the context of that industry in economic terms. We refrain from pursuing other roundabout methods of valuation (e.g. those least-costs-of-substitution ones proposed in [6] where the estimates return zero or negative-valued economic industry rents, and consider such instances as zero-valued uses of water. We also chose to aggregate in industry-wide rent calculations only those enterprises which have positive rolling-average operating performance indicators on which economic rent estimates are based (i.e. the industry-wide sample is purged of enterprises with a priori negative rents). This is justified on the basis of the Ricardian notion of differential rent, where the rent is viewed as any overage, or surplus, above the basic acceptable conditions or reproduction—continuously recorded negative operating surplus in that sense is not a viable “condition of reproduction”.
Given this approach, it is clear that our aim is not to obtain the maximum, but best-substantiated assessment of the value of national water resources for statistical purposes, subject to the assumptions and limitations of the analysis listed below.
Assumptions of and limitations to the experimental study
The following assumptions underlie the obtained experimental estimates:
1. Only economic assets generating benefits over the averaging period of rent assessment are subject to valuation. That is, we consider only economic effects from the use of water resources without incorporating into the estimates the effects of water assimilative potential or the value of ecosystem services provided by water. In line with SNA 2008 provisions, our focus is the economic value, not the total (existence) value of the resource, which can be more exhaustively explored in the context of satellite accounts such as can be drawn under the provisions of SEEA-Water document [10].
2. Two types of institutional units drawing income from the use of water resources are considered for valuation purposes – the state as a titular owner which supervises the use of water resources, and the economic entities – enterprises with primary reliance on water use belonging to various branches of the economy – with their selection as explained below.
3. Estimates were conducted on the macro- (national economy) level, with separate trials also undertaken on the river-basin basis.
4. Since the market for water resources and water abstraction rights is absent in Russia, with market prices failing to register in consequence, the water rent capitalization technique, a specie of the residual (NPV) approach, has been put to use as a primary valuation tool.
5. Due to the limitations of the national statistics on water use in physical terms and related abstraction data, only two statistical quality classes for water resources have been identified and considered in the analysis – underground (artesian, subterranean) water, and surface water. No further differentiation for water quality has been provided, and both identified categories of water are treated independently of each other, i.e. even though the surface-to-underground-to-surface water circuits may exist in the physical water analysis, no such processes are recorded in the value accounts – among other things, because either category of the water resource is not in deficit on the macro-level of the analysis.
6. The degree of accuracy of the analysis is limited by the degree of robustness of the data inputs contained in the public industry database used (EMISS by Rosstat), Water Resource Agency, Natural Resource Agency and the Federal Tax authority databases. On macro-level, the fact that an entity may abstract water in one region but return statistical forms (accounting statements, water abstraction statements etc.) in another region depending on its registration with tax authorities is less of a concern than for a regional basin-wide analysis, but various forms of tax optimization, joint economic activities reported under one industrial code etc., may bias statistical inputs.
Description of the water rent capitalization technique proposed
Two models are used to value water resources depending on the classification of particular selected industries on the basis of the extent of contribution of water resources to their core production activities – mono-industries, and mixed use industries.
Mono-industries are those industries the core activities in which are closely associated with the use/consumption of water resources (hydroelectric generation, mineral water bottling, fishing, communal water supply to households etc.). The entire elicited economic rent in such industries is fully attributed to water rent – since it forms the overwhelming basis for generation of value-added in those industries. The production becomes untenable and halts without water.
Among identified mixed-use industries for water are those industries in which the water is a substantial, but not the sole contributant to the produced output (irrigated agriculture, some water intensive metallurgical and chemical industry classifications). In such industries other production factors are also material contributants to the value-added, for example, land in irrigated agriculture, intellectual property and intangible assets in the industrial branches, etc.). Given the consideration of mixed-use industries spectrum, our experimental approach appears to be broader in scope than other referred applications of the residual technique for SNA water valuation purposes. Often, as in the case of UK, these applications are limited by only the consideration of water-supplying and agricultural industries [3]. By contrast, our application also places considerable emphasis on the importance of water to the value-added and economic rents generated in the mixed-use industries.
Economic rent is a term occasionally used but only definitionally adumbrated in SNA 2008 [1, 20.45) – to the extent that it implies financial yield on “capital services” provided by assets; in other contexts the term used to be often defined as “unearned surplus”, or “residual income” (which gave name to “residual techniques” of economic rent elicitation). As applicable to industrial branches, the economic rent is calculated as a part of the operating income from the sales of goods and services by the industry less a deduction for capital (plant, property and equipment) charges.
Indeed, in SEEA-Framework [11] document, which forms the basis for compiling “green” satellite accounts to SNA, Economic rent is explicitly considered as:
“the surplus value accruing to the extractor or user of an asset [natural resource] calculated after all costs and normal returns have been taken into account. The surplus value, referred to as resource rent in the context of environmental assets, can be taken to be the return attributable to the asset [natural resource] itself.” [11, pp. 5.113-5.114]
Thus, the resource rent is a part of economic rent arising in the form of surplus value from using a certain natural resource and accruing to the user of that resource (or being generated by an industry as a whole). Same as for economic rent, it is estimated as a residual income remaining after deductions from the operating profit of all costs and returns on plant and equipment items and working capital employed by the user (or within the industry), – with that difference that the residual income is also reduced by returns accruing on other co-employed production factors and natural resources. Within the SNA accountancy context, the economic rent is a sole source of resource rent allowed under the SNA-2008 document. In mono-industries, therefore, the economic rent coincides with the resource rent. And as applied to water resources, the resource rent is otherwise referred to as the “water rent”.
The technique for estimating the value of water resources employed
The value of water resources is determined as the sum of capitalized resource rents derivable by entities within the principal water-consuming industries (mono and mixed-use) and capitalized rent received by the state in the form of water tax and water-use payments:
VW = Ven + Vg , (1)
where Vw – is a water resource valuation; in the National currency units (NCUs);
Vеn – capitalized resource (water) rent (i.e. at present value) obtained in the aggregate by the economic entities in the water-using industries (averaged on the rolling basis); in NCUs;
Vg – capitalized resource rent obtained, in the aggregate, by the state; in NCUs.
The capitalized rent of the economic entities is calculated as the sum of capitalized industry rents:
 (2)
(2)
where ERi – is the averaged (on the 5-year rolling basis) resource rent obtained by the industry i; i = 1, 2 … n; as estimated under formula (3); in NCUs; (given the non-negligible national-currency headline rate of inflation in the country, the averaging process also included adjustments for the pace of inflation in the 5-year interim – in order to express the ERi values subject to averaging on a comparable basis).
n – the number of the principal water-using industries being considered;
е – the discount rate; the market-based risk-free rate on the NCU market can be employed for that (on the real-terms basis, i.e. net of inflation); for example, we have used the rubble – denominated long-term federal bonds yield which, netted of inflation, has been estimated to be at the long-term value of approximately 0.05 (5 % per annum). Thus, by employing the direct (annuity) capitalization technique to the capitalization of resource rent Formula (2) assumes that there will be no (real, ex ante) growth in the rents going forward, which assumption is justified by the current stagnant long-term outlook for the national economy plus that the overall economic significance of the major water-using industries accounted for will remain as before. This doesn’t mean, however, that the water valuation result should remain one and the same for SNA purposes going forward. The SNA system of natural resource accounting provides for recurrent, at least annual, revaluations of the natural resources. Since the water rent used for the capitalization is a sliding historical average of the past calculated rents, the valuation figure will undergo change from year to year, capturing, on the ex-post basis, the change in the calculated rents (see Table 1).
For mono-industries, the ERi rent is determinable as:
ERi = PSi – VBi×R, (3)
where PSi – is the operating (gross) sales profit in the considered industry i; it reflects statistically aggregated accounting “sales profit” of reporting entities on the industry level, as reported in the Rosstat’ EMISS database [12] (loss-making enterprises are excluded, not netted, in the industry aggregate); The choice of “gross sales profits” as an apex indicator from which the economic rent is derived is informed by the consideration that it best reflects immediate operating activities of enterprises in the industry grouping net of subsidies, thus this indicator based on aggregated industry-level data collected from accounting statements of enterprises filed with Rosstat suggests itself as the best available proxy on which the estimates can be based.
R – Rate of return on capital in the country, or the average returns on industrial investments. This metric is usually used in the residual valuation techniques to separate income accruing to the specific natural resource, i.e. water, or other resource, rent, and is functionally intended to account for excluded returns on produced assets by the identification of full “user costs”. Accordingly, VBi×R – stands for the (to be excluded) contribution to income/profit generation of plant, property and equipment items (PP&E) in industry i, given the rate or return R;
On the macroeconomic level, the rate of return on capital represents the average “profitability” of invested capital which can be used to determine the rate of return on produced assets (in our instance, Plant, Property and Equipment items employed within the industry).
The rate of return on capital investments, R, can be based on internal industry measures (such as an average Internal Rate of Return (IRR) estimated on projects within the industry) or, else, can be externally determined in nominal terms on the basis of the federal securities market (i.e. GKO and OFZ bonds). The experimental estimates presented in this Paper feature the nominal rate of return of 5 % across all the considered industries (which seems to reflect the secular inferior conditions of profitability and performance in the overall industrial sector of the economy compared to its financial sector).
For mixed-use industries, the ERi rent was determined as:
ERi = Kwr i ×(PSi – VBi×R). (4)
Where, additionally to formula (3), Kwri – is the water rent share in the overall economic rent for the mixed-use industry i., while the VBi variable also includes in its base the value of Land, since Land can be an appreciable production factor in the mixed-use industries.
It is advised that Kwri factor be determined on the basis of more detailed surveys of water and land contribution to the generation of the industry economic rents – which can be achieved on the basis of more detailed linear programming techniques. One of such methods is the production function approach. Essentially, such a method is a detailization of the resource rent capitalization techniques as applied to mixed-used industries. It enables to optimally distribute the economic rent between other production factors over and above water resources – within the context of mixed-use industries. This method has enjoyed a measure of recognition in valuing water resources (albeit in policy contexts other than for SNA accounting purposes) – both in the developed, as well as developing counties, and scores a mention in both SEEA-Framework [11], and SEEA-Water [10] documents. The latter document (p. 125,130) records 7 instances of its application to valuing water resources in the US as of the year 2000. It has also been experimented with in the Canadian context, as well as in India and China. However, the Russian statistics wouldn’t be able to support its applicability without making the primary statistical data available (which are deemed to be confidential under the Russian Statistical Observations Law). To date, we are not aware of its applications to the national water resources in whatever context.
Since the subject estimates bore an experimental nature and the entire project aimed to offer an algorithm to estimate the value of water resources on the basis of available statistical information, the Kwri factor wasn’t elaborated in any great detail for different mixed-use industries: it was assumed at 0,1 for all mixed-use industries, except for irrigated agriculture where its value of 0,2 has been used.
The imputed value of 0,1 is optimal on many counts. It is determined proceeding from the fact that the contribution of water resources to economic rent generation in mixed-use industries can be accepted to be approximately the same as the contribution of land to overall value of production assets. The share of the land value, according to the analysis of domestic and international statistical sources on market prices of the industrial real estate, usually doesn’t exceed 10 % in the overall value of industrial concerns [2]. The 20 % share of water rent for agriculture can also be considered at an optimal level, since in irrigated agriculture where the water rent can principally be generated agricultural yields are boosted by a factor of 300–400 % compared to non-irrigated agriculture, while the share of lands under irrigation in the country can be estimated at about 7–10 %. The international practice of experimental SNA -compliant water valuations records the cases of application of Kwri equal to 30 % (e.g. for Netherlands, as reported in [6], economic rents generated in the agricultural sector.
It would be expedient in further exploratory work to differentiate the water rent share depending on each particular industry employing the methods of factor analysis, including the production function approach mentioned above.
Having regard to institutional arrangements for water use payments in Russia, the rent accruing to the state (Vg) has been determined as:
 (5)
(5)
where PPW i – are the aggregate annual payments of economic entities operating within industry i to the state for the discharge of contaminants into water bodies, i = 1,2, … n;
Tw – are the aggregate state revenues from the water tax payable by all water users; if ground water is to be included into the valuation analysis, this element of proceeds should also include the respective tax levied on extraction of mineral resources, since a part of subterranean water resource extraction is taxable under this heading;
PAW – aggregate annual payments for water use rights, including under contractual negotiated arrangements with the state, etc;
е – the discount rate.
The water valuations thus obtained under formulas 1-5 are absolute values in NCUs which can be included within the national wealth accounts on par with other non-produced assets.
Findings from the experimental estimates
We report our findings on the water resource monetary estimates in both NCU (Russian rubble) amounts and the converted US dollar amounts. The Purchasing Power Parity (PPP) exchange rate has been used for such a conversion. The value of rubble exchange rate to US dollar at PPP has been reckoned to be at about 25 rubbles per 1 USD (the exchange rate during the year of experimental estimates (2013), at about 30 rubbles to the dollar, has been close to this parity, while, following the devaluation of rubble in late 2014, the current market exchange rate of about 60 rubbles per 1 dollar deviates from this PPP value by a factor of about 2,5 (e.g. see [14]). In line with SNA-2008 economic asset boundary requirements, only the water in inland water bodies was considered – not oceans, or seas. As a result of our experimental water resource valuations, the overall value of water resources for Russia has been estimated at about 4 trln. rubbles (or around USD 150 bln., if converted at PPP exchange rate of 25 rubbles to US dollar) for 2013 (or at about 5,5 % of the Russian GDP at 2013 current prices) . Out of which 3,3 trln. rubble value falls on account of the surface water resources, and 0,7 trln. rubbles accounts for the value of the ground water.
This can be treated as a minor component in the structure of the national wealth. It represents short of 1,5 % of the value of the produced capital in Russia (on the basis of Rosstat (2017) related-period data on the National Assets and Liabilities Balance).
The breakdown of water resource valuation estimates between the surface and ground water categories for the year 2013, being the year for which we undertook the experimental estimates, is presented in Table 1. This table is drafted in a format consistent for incorporation into SNA sectoral asset accounts (given the legal situation with water ownership in Russia, the 100 % owner of the resource, as explained above, is the general government itself, therefore, no presentation of changes through the financial (transactional) account is required).
The estimates featured the requisite industry performance (i.e. gross operating profit (“profit from sales”), and net carrying amount of PP&E items) and water consumption (abstraction) data derived from the EMISS database for 20 industries accounting for more than 60 % of water abstraction in the country, as well as those that use water without abstracting it (i.e. the fishing industry, and inland water transport) Out of these 20 industries, 8 have been classified as mono-industries, while the remaining 12 – were considered to be the mixed-use industries..
The application of the uniform valuation methodology for water resources, coupled with the estimating process based on official data on the value of plant, property and equipment assets and industry-level operating profits, has enabled to obtain the indicators of value for the water resources which are commensurate with the value of other assets considered in the assessment of the national wealth and statistical treatment thereof. So ensuring comparability with reference to matching discount rates, rates of return etc. vis-a-vis other national natural resource estimates (e.g. for Land) has been a priority.
Table 1
Experimental macro-level valuation of the Russian water resources for 2013
|
Level of valuation |
General government sector: Value of water resources as at 01.01.2013, in bln. rubles (USD $ bln.at PPP), at current prices |
||
|
Ground water |
Surface water |
Total for water resources |
|
|
The Russian Federation |
657,8 (26,3) |
3 277,0 (131,1) |
3 934,9 (157,4) |
|
For reference: Ground water/surface water ratio |
17 % |
83 % |
100 % |
|
Changes over 2013, incl. on account of: |
|||
|
– financial account/ transactions |
0 |
0 |
0 |
|
– other changes in the volume of assets account |
0 |
0 |
0 |
|
– revaluation account [of which the real holding gain/loss*] |
18,9 (0,76) [-15,3(0,61)] |
322,5 (12,9) [152,1(6,0)] |
341,3 (13,6) [136,7(5,47)] |
|
General government sector: Value of water resources as at 01.01.2014, in bln. rubles (USD $ bln.at PPP), at current prices |
|||
|
The Russian Federation |
676,7 (27,0) |
3 599,5 (144,0) |
4 276,2 (171,0) |
|
For reference: Ground water/surface water ratio |
15,8 % |
84,2 % |
100 % |
|
Notes: *“real holding gain/loss” is that part of the revaluation account which exceeds the revaluation (the resource value appreciation/depreciation) had it proceeded in exact conformity with the inflation rate prevailing in the country (5,2 % CPI inflation rate for Russia in 2013). |
|||
Source: authors’ estimates.
Distribution of water rents across major water using industries
Table 2
Distribution of water rents accruing to economic enterprises across the analyzed industries for 2013
|
Industries |
2013 |
|
|
Water rent, in bln. rubles ($ mln, at PPP) |
Contribution of the industry-level water rent to the overall water rent estimate |
|
|
Mono-industries: |
||
|
Fishing and harvesting of aquatic cultures in rivers and lakes – by all types of producers |
0 |
0 % |
|
Activities of inland water transport |
1,4 (56) |
1 % |
|
Generation of electricity by hydroelectric stations |
35,6 (1424) |
18 % |
|
Production, transmission and distribution of steam and hot water (thermal power) |
0 |
0 % |
|
Fish-breeding |
0,6 (24) |
0 % |
|
Collection, purification and distribution of water |
0 |
0 % |
|
Production of mineral waters |
2 (80) |
1 % |
|
Collection of water discharges, refuse run-off and similar activities (drainage industry) |
0 |
0 % |
|
Total for mono-industries |
39,6 (1584) |
20 % |
|
Mixed-use industries: |
||
|
Manufacture of cellulose, wood pulp, paper, cardboard and items made out of them |
3,9 (156) |
2 % |
|
Production of electricity by thermal powerplants |
5,4 (216) |
3 % |
|
Crop agriculture |
11,1 (444) |
6 % |
|
Animal farming |
1,3 (52) |
1 % |
|
Extraction and enrichment of iron ores |
15,6 (624) |
8 % |
|
Extraction and enrichment of non-ferrous ores, except for uranium and thorium ores |
11,9 (476) |
6 % |
|
Chemical production |
28,7 (1148) |
15 % |
|
Production of cast-iron, steel and ferrous alloys |
8,3 (332) |
4 % |
|
Manufacture of artificial and synthetic fibers |
0,1 (4) |
0 % |
|
Aluminium production |
2,3 (92) |
1 % |
|
Production of coke and oil products |
68,4 (2736) |
35 % |
|
Total for mixed-use industries |
157,1 (6284) |
80 % |
|
Total |
196,7 (7868) |
100 % |
Source: authors’ estimates.
The analysis of data in table 2 demonstrates that it is mixed-use industries that generate most (80 %) of overall water rent in the country – highlighting the importance of not neglecting the rents formed in those industries in which many industrial processes depend on the continuous consumption of water. At the same time, it is for mono-industries where the estimate is the more immediate, less “experimental” and more reliable one: it appears that the mono-industries are roughly accountable for 20 % of overall water rent generation. However, about half of the mono-industries are patently loss-making or have zero-bounded economic rents (in part, due to peculiarities of pricing in those industries, e.g. water supply and canalization industries are subject to the state regulation of tariffs which are based on the cost-recovery principles and, thus, do not allow for any rents). Such industries in which the rent doesn’t manifest itself include: fishing in inland waters; production, transfer and distribution of steam and hot water (thermal power); collection, purification and distribution of water, as well as the drainage industry. In a sense, water is still a “non-economic good” in these industries – that is often due to the tarification principles used for the output of those industries, which sometimes allow only for the recovery of costs.
The principal contribution to the generation of water rents in the mono-industries is on account of the hydro-electogeneration industry. This industry accounts for more than 90 % of all water rents generated in industries classified as mono-industries: 35 bln. rubles ($1,4 bln.) out of 39,6 bln. rubles ($1,58 bln.) of elicited mono-industry water rents. (The estimates for water rent in the hydroelectric generation industry have been also cross-checked by an analysis under the least-costs method, i.e. through multiplication of the volume of electric power annually produced on hydro-electric installations within the country by economic savings achievable through generating electricity on hydroelectric-plants compared to using the next least-costs alternative of thermal plants. The estimates under this method for major hydroelectric plants consolidated into the Rushydro holding yielded about 19 bln. rubbles in annual water rent, which is a fair match for the 35 bln. rubble estimate obtained under the water rent capitalization technique). The second running rent-generating industry in this group is the mineral water bottling industry (that accounted for about 2 bln rubbles in water rent for 2013).
Thus, the elicited water rent across all water-using industries in the aggregate (net of the share captured by the state in the form of water taxes and payments) has been estimated at close to 200 bln. rubbles. ($8 bln. at the PPP rate) (See Tables 2 and 3). In this context, only the minority of overall water rent (less than 10 %) is collected by the state in the form of compulsory water payments – PPW, Tw and PAW (water tax, discharge tax, or contractual water rates levied on industrial water users, which are the bulk of water taxation) – Also see Table 5.
Transitioning to unit valuations of abstracted water resources
For practical water management purposes, including the analysis of efficiency of water use policies and water taxation impact—both on the country-wide and industry specific level, – it is expedient to further develop unit valuations of water resources consumed in the economy:
 (6)
(6)
where RW u – is a unit rental (annual) valuation of water resources deriving from the SNA-2008 conformable estimates developed above; NCUs./cubic.m;
WR – aggregate water rent; in NCUs;
BW – annual volume of water resourced used (i.e. consumed or abstracted) in the analyzed industrial sectors; NCUs/cubic m./year.
The aggregate water rent WR has been estimated as:
 (7)
(7)
where ERi –water rent remaining with the economic entities (industries), in NCUs;
Rg – water rent accruing to the state, in NCUs;
Similarly, the water rent accruing to the state (Rg) has been determined as:
 (8)
(8)
where the right-hand side notation used is identical to one already defined in the context of Formula (5).
In transitioning to unit values one should bear in mind their certain notional character associated with the inherent features of water use. The peculiarity lies in the fact that quite a number of industries rely on the water use without abstracting water in the first place – in connection with which it is not always possible to apportion on a fair basis the amount of water consumed by them (i.e. inland water transport, fishing, hydro-electric generation, etc). Therefore, prorating the overall amount of elicited water rent to just water industries that rely on water abstraction (as was done) is liable to result in slight overstatement of the average unit values. On the other hand, where unit valuations relate to specific water-abstracting industries the degree of accuracy is only compounded by the inexactitude of water abstraction statistics (In Russia, water-using industries that pay water tax or have water-abstraction agreements with the state in place have to self-report to Water Authority on the annual basis as to the amount of water abstracted (and discharged) by them-- with breakdown by ground and surface water sources. There might, therefore, be a slight downward bias in the annual water abstractions reported to the Authority compounding the overstatement of unit valuations derived, as some water-using agreements make water payments to the state contingent on the amount of water abstracted).
The unit valuation we report on below can be notionally termed as a rental value of water on the macro-level (or a unit water rent), or the value of water abstraction – if differentiated between abstractions by water-using industries.
The estimated average unit water rent for Russia has amounted to 3,8 rubles (15 US cents at the PPP exchange rate) per cubic m. of abstracted water in 2013 in overall terms. For mono-industries – the respective estimate was 2,7 rub/cubic m. (11 US cents) , while for mixed-use industries the derived estimate is about twice higher – at 5,6 rubles (22 US cents)/cubic m. (See Table 3).
The USA is one of the few jurisdictions, in which a developed water resource market exists. By way of cross-checking, a comparison of the estimates derived with the value of water abstraction rights prevailing on the US market (based on the unit market prices reported for sales of short-term water rights in agriculture for 11 Western semi-arid US states) – see Table 4 – indicates the closeness of estimates and similarities in the order-of-magnitude, which is the additional supporting justification for the soundness of the estimates of water rent obtained for the Russian water resources – since, whatever the strictures on the usage of the benefits transfer method in the SNA-compliant natural resource valuations, the sales comparison (market) approach to valuation is the ultimate touchstone of the robustness of valuations reported.
Fig. 1 depicts the diagram with the unit valuation of water abstraction for mixed-use industries in Russia for the year 2013, which is based on the derived industry-level water rents and the volume of water abstracted from the surface and ground sources.
Table 3
Estimates of water rent accruing to economic entities in the principal water using industries in Russia, 2013
|
Waterusers |
Water rent, in bln.rubbles ($ bln. at PPP) |
Water abstraction, in cubic kms. |
Unit valuations of water rent, in rubbles/cubic m., (US cents at PPP per cubic m.) |
|
Mono-industries |
39,6 (1,6) |
14,7 |
2,7 (11) |
|
Mixed-use industries |
157,0 (6,28) |
27,8 |
5,6 (22) |
|
TOTAL |
196,7 (7,9) |
42,5 |
3,8 (15) |
Source: authors’ estimates.
Table 4
Median unit value of water abstraction rights on the US water market, as determined on the basis of recorded transactions in which short-term water rights (1-year leases) were sold by the agricultural sector to municipal water-users, data for 1987-2005
|
State |
1-year lease |
|
|
$/acre-foot |
$/cubic.m |
|
|
Arizona |
55 |
0,045 |
|
California |
83 |
0,067 |
|
Colorado |
29 |
0,024 |
|
Idaho |
2 |
0,002 |
|
Montana |
18 |
0,015 |
|
Nevada |
24 |
0,019 |
|
Oregon |
6 |
0,005 |
|
Texas |
19 |
0,015 |
|
Utah |
92 |
0,075 |
|
Washington |
25 |
0,020 |
|
Wyoming |
45 |
0,036 |
Source: Brewer et al, 2007; as adapted in [9, p. 235].
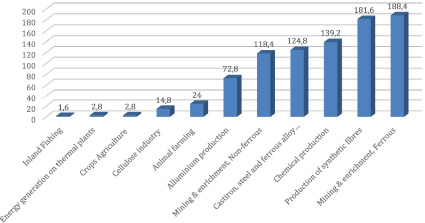
Fig 1. Unit valuations of water abstraction by mixed-use industries 2013, US cents at PPP/cubic.m
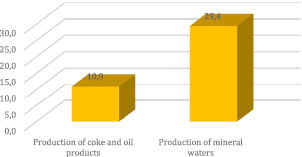
Fig. 2. Industries with the highest unit valuations of water abstraction in 2013, USD PPP/cubic. m. Source: Authors’ estimates
High values of unit rent valuations have been elicited for coke and oil production industry (10 USD at PPP per cubic meter), for the ferrous mining and enrichment industry (1,88 USD at PPP per cubic m.), production of synthetic and artificial fibres (1,81 USD PPP/cubic.m), in chemical production overall (DG code) – at 1,39 USD per cubic.m.), and mining and enrichment of non-ferrous ores, except for thorium and uranium ores – at 1,18 USD PPP per cubic. m.
Since mono-industries recording positive water rent (hydroelectric power generation, inland water transport, fishing) represent non-consumptive uses of water (with the exception of the production on mineral waters), any unit valuations of water rent based on water abstraction would be devoid of common sense for them.
At the same time, the mineral waters “production” (i.e. bottling) industry is characterized by the highest unit valuation for water rent among all the 20 water-using industries surveyed – the unit valuation estimate for it in 2013 stands at 29,4 USD PPP per cubic.m. of (ground) water withdrawn (Fig. 2).
Distribution of water rent between surface and ground waters and estimates of the rental appropriation by the state
Based on the data obtained for industrial water abstraction from surface and ground water categories, it is possible to allocate the aggregate water rent valuation between ground and surface waters (see. Table 5) – relying on the same proportion as for the annual volume of water abstraction from the ground and surface sources.
The share of water rent from the use of surface waters captured by the state doesn’t exceed the level of 9-10 %, that for the ground waters – is only at 5 %, i.e. twice less. This indicates the existence of possibilities to increase the compulsory payments for water use by 2-3 times. But such an increase should bear a targeted (industry-differentiated) character, since not all analyzed water-using industries demonstrate the existence of positive water rents. In some industries, the economic rent can be negative – the industry being subsidized due to its socially important character (e.g. water supply to households).
As attested by the data from our experimental estimates (Table 5), the elicited aggregate annual water rent (212,8 rubble bln, or about $8,5 bln.at PPP) is,in principle, comparable by its order of magnitude with the volumes of annual funding allocated by the state for the maintenance and development of the water infrastructure of the country (around 200 bln. rubles-- principally originating from the public budgetary sources – are annually expended for these purposes [15]. Thus, such expenditures seem to be justified on economic grounds as being conducive to the generation of the water rents of comparable magnitudes in various branches of the economy associated with the intensive water-use.
Resulting policy suggestions and conclusions
The level of water rent generated in Russia as a whole points to overall economic efficiency of operating and investment costs borne by the water-management sector (i.e. more than 200 bln. rubbles per annum, or about $3,5 bln. at the current market exchange rate).
The analysis we undertook also provides an economic justification, or illustrates the case, for the increase in statutory water-use charges – as the share of water rent captured by the state through the existing water taxes and contractual water use charges falls short of even 10 % level on the country-wide basis.
The elicited high degree of differentiation of macro-level unit valuations for water rent (on water abstraction basis) – from under 1 rubble per cubic m. of abstracted water in agriculture, to 750 rubbles per cubic m. in the mineral water bottling industry – attests to the untapped possibility for switching to the industry-differentiated structure for statutory water-use charges, instead of pursuing the flat-rate water taxes/contractual charges.
Preparation of the water resource balance (in value terms) on the macro-level is not too labour-consuming an exercise, and can be recommended for the regular work-plans of the Statistical Agency in the process of compilation of the national accounts for the public sector.
Table 5
Macro-level distribution of the aggregate water rent as between surface and ground water sources and as between the state and other economic entities
|
Aggregate water rent on the macro-level (un-capitalized basis), 2013 |
All sources, bln. rubbles (PPP $ billion) |
Out of which: |
|
|
Surface water sources, in bln. rubbles (PPP $ billion) |
Ground water sources, in bln. rubbles, (PPP $ billion) |
||
|
Aggregate rent from water resources on macro-level, including: |
213,8 (8,5) |
179,9 (7,16) |
33,8 (1,35) |
|
due to water rent accruing to water-users |
196,7 (7,8) |
164, 5 (6,58) |
32, 1 (1,28) |
|
due to water rent extracted by the state in the form of compulsory water-use payments and taxes. |
17,1 (0,7) |
15,4 (0,61) |
1,7 (0,07) |
|
Share of water rent extracted by the state, in % of overall rent. |
8,0 % |
8,6 % |
5,0 % |
Sources: authors’ estimates.
Reinforcing the presentation on the macro-level in this Paper, the analysis of water rent generation on the basin-wide basis additionally undertaken by us (for Pechora, Don and Ob’ river basins) that relied on water-user’s statistics from 30 constituent entities of the Russian Federation has also confirmed the view that the major role in water rent generation is likewise played by mixed-use industries. In this connection, it appears reasonable on cost-benefit basis to advocate further studies aiming to develop complex statistical factor analysis models in order to elicit, and achieve allocation, of water rent in mixed-use industries on a more refined basis and then proceed to implementing industry-differentiated policy on water-use charges.