
Scientific journal
European Journal of Natural History
ISSN 2073-4972
ИФ РИНЦ = 0.204
NEW APPROACH TO PREDICTING CHANGE IN AQUATIC ECOSYSTEMS WITHOUT HAVING LONG-TERM MONITORING DATA

According to IPCC assessment report, during the 20th century the average annual temperature at the surface of the Earth increased by 0.6 °, the ice cover duration of inland waters in the middle and high latitudes of the northern hemisphere decreased by 2 weeks [1]. Issues of assessment and prediction of changes in the structure of aquatic ecosystem communities become more relevant due to global climate change. Obviously, the basis for building predictable models is the database obtained as a result of long-term monitoring observations. But due to the remoteness and inaccessibility for researchers at the vast areas of Far North, there is a lack or complete absence of long-term data on aquatic ecosystems. In contrast according to a number of researchers, transformations caused by global climatic changes may be the most dramatic in northern regions with continuous spread of permafrost [2]. Eastern Siberia is among these.
We discuss the aspects of the spatial floristic and coenotic structure of the largest rivers of Eastern Siberia phytoplankton in our last publication [3]. The materials that guide the study are an array of data on the phytoplankton of 12 large subarctic rivers, their hydrochemical, hydrological and morphometric parameters and climatic characteristics of the catchment areas. The information we obtained on phytoplankton has a wide geographical scale, but was not monitored, instead was selected on the rivers of Eastern Siberia in different years during the summer runoff low. From this the most important factors of the environment involved in the phytoplankton of large subarctic rivers spatial structure formation in the gamma-diversity scale were identified. The results we obtained show that the formation of the spatial structure of phytoplankton in the rivers of NorthEastern Siberia occurs mainly under the influence of climate.
The aim of this research is to propose an approach to predicting change in the components of aquatic ecosystems due to global climate change in the absence of long-term data, exemplified by the phytoplankton of large rivers of Eastern Siberia.
Materials and methods of research
As the material for this publication we use the data on phytoplankton of 12 large rivers of Eastern Siberia: Lena, Vilyui, Kolyma, Aldan, Olenyok, Vitim, Indigirka, Amga, Olyokma, Anabar, Yana and Chara (Fig.1). The study area lies from 106 ° 53’ to 160 ° 58’ E in the meridional direction, and from 56 ° 13’ to 73 ° 10’ N in latitudinal direction. 800 plankton algological samples were collected in 2000-2011 from rivers both near banks and at middle course, within the surface water level (0-0.3 m of depth), during the summer runoff low (June-August) at the maximum phytoplankton vegetation period. Collection and processing of phytoplankton samples were carried out according with the methods of hydrobiology [4].
The analyzed data set includes 3 quantitative variables: number of species/number of families ratio, mean algal cells volume (μm 3) and total number of species in the sample. The data set contains only 303 observations (cases), which have no omissions that are inadmissible in the statistical data processing.
The statistical analysis procedures were performed in Statistica Automated Neural Networks (SANN) of Statistica 10 software package.
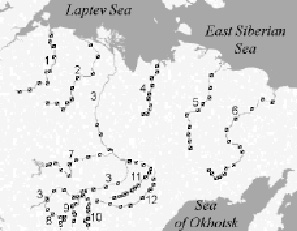
Fig. 1. Map of the studied area. References: 1 – Anabar River; 2 – Olenyok River; 3 – Lena River; 4 – Yana River; 5 – Indigirka River; 6 – Kolyma River; 7 – Vilyui River; 8 – Vitim River; 9 – Chara River; 10 – Olyokma River; 11 – Amga River; 12 – Aldan River
Results of research and their discussion
The results of our previous studies revealed a special regulatory role of environment climatic factors in the formation of phytoplankton spatial structure in the Eastern Siberia rivers [5]. The main ones (air temperature, Dynamic Habitat Index, duration of ice-free periods on rivers) are those regional climatic factors that determine the overall ecological stress of high-latitude habitats. The complex of climatic parameters included in the obtained statistical models indicates an important regulatory function of the vegetation period duration. The main results of our research indicate that the shorter the ice-free period, the lower the floristic proportions of plankton, the smaller the mean cell volume, the smaller the total number of species and more in the Chlorophyta and Bacillariophyta phyla, the smaller the total number of species, and the larger the number of Cyanoprokaryota [6]. The key to understand the “environment-phytoplankton” model in the studied region, which is the important discriminating factor that we determined, is the geographical latitude of sampling points. We show that with increasing latitude of sampling points, the basic floristic relations are reduced, that means the proportion of monotypic taxa increases. To use this data in constructing a predictable model, we suggest a space-for-time approach. The application of this method assumes that the spatial and temporal variations are equivalent as is known [7, 8].
The most important environmental factors in the spatial structure formation of the river phytoplankton in Eastern Siberia identified earlier by us are the duration of the ice-free period and the average annual air temperature, both change equivalently according to the “geographical scale” (with a decrease in the latitude of sampling points) and the “time scale”, this follows from IPCC specialists’ report [1].
From the perspective of this, when implementing our data to build a predictable model, the absent “time scale” should be replaced with the “geographical latitude of sampling points “ variable. To construct the model, we chose the artificial neural network method [9] because of neural networks ability to model nonlinear dependencies [10].
The data was entered into our analysis as time series ranked by decreasing latitude of sampling points. We used three indicators that has the strongest statistical dependency on the environmental parameters as the predictable parameters of phytoplankton [6]: number of species/number of families ratio, mean algal cells volume and total number of species in the sample.
Table 1
Summary of active networks (number of species/number of families ratio)
|
Index |
Networks name |
Training performance |
Test performance |
Validation performance |
Training algorithm |
Hidden activation |
Output activation |
|
1 |
MLP 151-8-1 |
0.96 |
0.74 |
0.60 |
BFGS 14 |
Logistic |
Identity |
|
4 |
MLP 151-8-1 |
0.88 |
0.67 |
0.57 |
BFGS 9 |
Tanh |
Logistic |
|
5 |
MLP 151-8-1 |
0.76 |
0.73 |
0.55 |
BFGS 5 |
Exponential |
Tanh |
|
2 |
MLP 151-3-1 |
0.75 |
0.70 |
0.60 |
BFGS 6 |
Logistic |
Identity |
|
3 |
MLP 151-2-1 |
0.54 |
0.72 |
0.61 |
BFGS 6 |
Logistic |
Logistic |
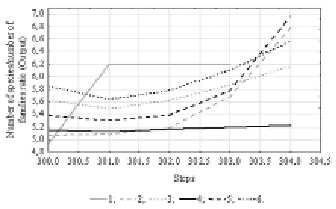
Fig. 2. Time series projection for variable “Number of species/number of families ratio”. References: 1 – Species/families ratio; 2 – [1.MLP 151-8-1]; 3 – [2.MLP 151-3-1]; 4 – [3.MLP 151-2-1]; 5 – [4.MLP 151-8-1]; 6 – [5.MLP 151-8-1]
At the first stage the predictable model included floristic species/families ratio. To reveal the data internal cyclicity an analytical method of Time Series spectral (Fourier) analysis was used. The results showed that within the 303 observations data pool there is a periodicity, the value of which corresponds to 151 units. Using data on the internal periodicity and applying the time series regression we trained 50 neural network models with the condition of a random subsampling method. 5 more performance networks were left in the analysis, which will predict the analyzed series of observations (table 1).
All networks represent a multilayer perceptron by type with 151 input, 1 output and 2 to 8 hidden neurons. In addition to architecture of neural network models, the summary presents the training algorithm and the number of the final iteration on which the model is obtained, as well as the method for activating hidden and output neurons. Networks are ranked by their performance, which is the correlation between the original data series and the predictable one, the closer this value is to 1, the better the model.
In order to predict changes in the floristic variable outside our sample set, a time-series projection was constructed (Fig. 2), where each next value of the time series is constructed from the previous values of the same time series. A continuous gray curve indicates the initial data series, other curves illustrate the predicted series for each neural network model. As we see in the graph of projections, most models, including the more performance ones, predict the growth of the floristic species/families ratio.
At the second stage, the total number of species in the sample indicator was included in the analysis. The results of Time Series spectral (Fourier) analysis showed the presence of internal cyclicity of data with 15 units period. A summary of 10 % of the best neural network models is presented in Table 2. Since the indicator of phytoplankton species total number showed a less dependency on environmental factors in our earlier studies [6], the productivity of the obtained models is somewhat lower than at the previous stage of analysis.
The time series projection graph (Fig. 3) shows that all more performance models predict a small increase in the total number of species in the sample.
At the final stage, the mean cell volume was included in the analysis. The analytical check revealed the existence of cyclic data with a 11 units period. 50 neural network models were constructed, information on the 5 more performance ones are presented in the table 3.
The mean cell volume index, according to our information [6], had the least strong dependency on environmental factors of the three phytoplankton indicators included in our analysis. This is why our neural network models showed relatively low performance. The graph of the time series projection illustrates the prediction of a small decrease in the plankton algal cell volume (Fig.4).
Therefore, the results of our analysis show that due to current trends in climate change, one should expect an increase in floristic proportions as the most probable response of high-latitude phytoplankton communities, that means reduction in the number of monotypic species in the planktonic flora. It is also possible that the phytoplankton cells will decrease in size, which may be due to eutrophication of rivers. The possible increase in the number of algal species in the sample will probably results from invasive plankton species.
Table 2
Summary of active networks (total number of species in the sample)
|
Index |
Networks name |
Training performance |
Test performance |
Validation performance |
Training algorithm |
Hidden activation |
Output activation |
|
3 |
MLP 15-2-1 |
0.59 |
0.37 |
0.42 |
BFGS 39 |
Exponential |
Tanh |
|
25 |
MLP 15-2-1 |
0.56 |
0.24 |
0.38 |
BFGS 23 |
Logistic |
Identity |
|
9 |
MLP 15-5-1 |
0.51 |
0.24 |
0.32 |
BFGS 7 |
Identity |
Identity |
|
7 |
MLP 15-7-1 |
0.51 |
0.23 |
0.32 |
BFGS 6 |
Identity |
Identity |
|
20 |
MLP 15-7-1 |
0.51 |
0.22 |
0.31 |
BFGS 6 |
Identity |
Identity |
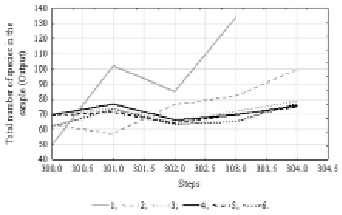
Fig. 3. Time series projection for variable “Total number of species in the sample”. References: 1 – Total number of species in the sample; 2 – [3.MLP 15-2-1]; 3 – [7.MLP 15-7-1]; 4 – [9.MLP 15-5-1]; 5 – [20.MLP 15-7-1]; 6 – [25.MLP 15-2-1]
Table 3
Summary of active networks (mean cell volume)
|
Index |
Networks name |
Training performance |
Test performance |
Validation performance |
Training algorithm |
Hidden activation |
Output activation |
|
16 |
MLP 11-7-1 |
0.38 |
0.39 |
0.73 |
BFGS 6 |
Logistic |
Identity |
|
17 |
MLP 11-2-1 |
0.37 |
0.38 |
0.74 |
BFGS 7 |
Logistic |
Identity |
|
18 |
MLP 11-6-1 |
0.38 |
0.37 |
0.74 |
BFGS 6 |
Logistic |
Identity |
|
19 |
MLP 11-5-1 |
0.37 |
0.40 |
0.74 |
BFGS 7 |
Logistic |
Identity |
|
20 |
MLP 11-3-1 |
0.37 |
0.39 |
0.74 |
BFGS 5 |
Logistic |
Identity |
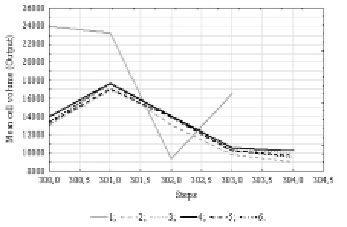
Fig. 4. Time series projection for variable “Mean cell volume”. References: 1 – Mean cell volume; 2 – [16.MLP 11-7-1]; 3 – [17.MLP 11-2-1]; 4 – [18.MLP 11-6-1]; 5 – [19.MLP 11-5-1]; 6 – [20.MLP 11-3-1]
Conclusions
We presented an approach that makes it possible to predict changes in the components of aquatic ecosystems using data that covers a vast geographical region without long-term monitoring information. The approach has its limitations. Thus, the “time scale” introduced by us into the analysis is obtained by the space-for-time substitution, has no real time values, therefore is not locked to time, and does not allow to analyze the time scale of the obtained prediction. The result of the prediction only states the current change trend in the analyzed variable. In addition, the analysis of time series allows one model to perform a prediction for only one target variable.
Despite the limitations, our approach will be useful for statistical prediction of aquatic ecosystems components in the poorly studied regions of the North and Siberia, which often lack long-term monitoring data on many components of aquatic ecosystems. An important advantage of the proposed approach is that it is based on analytical methods of statistics and allows you to get away from subjectivity in prediction problem solutions, which become more relevant today.
The work was carried out as part of the IBPC SB RAS state task for 2017-2020 yy. on “Fundamental and Applied Aspects of Flora Variety in Northern and Central Yakutia” (0376-2018-0001; ref. number АААА-А17-117020110056-0).
Библиографическая ссылка
Gabyshev V.A. NEW APPROACH TO PREDICTING CHANGE IN AQUATIC ECOSYSTEMS WITHOUT HAVING LONG-TERM MONITORING DATA // European Journal of Natural History. 2018. № 3. ;URL: https://world-science.ru/en/article/view?id=33878 (дата обращения: 04.07.2026).
DOI: https://doi.org/10.17513/ejnh.33878