

Plants have different defense mechanisms against stress factors. These defense mechanisms are regulated by changes of the expression of stress genes. Drought stress causes significant changes in the amounts of photosynthetic pigments and proteins, spectral properties, and photochemical activity of chloroplasts. Drought tolerant genotypes can protectthemselvesfrom stress by high photosynthetic activity [1]. The adaptation of plants to stress is directly related to the protein system of the membrane and responds to stress with quantitative and qualitative reconstruction [2].
According to the literature, the rheological composition of gluten in wheat grain is largely determined by the ratio of gliadine to glutenin. An increase in this ratio leads to a weakening of gluten [3]. Each gliadin group specifically has a significant effect on grain quality [4, 5, 6]. Glutenins are divided into two subunits. 1. High molecular weight (HWS). 2. Low molecular weight subunits (LWS). They form the molecular structure of gluten, affecting the properties of the dough, such as elasticity and strength. Gliadins, like monomeric proteins, provide the dough with stickiness and viscosity. Quality wheat must have a high protein, calcium and sedimentation index.
Currently, the Genetic Resources Institute of the National Academy of Sciences of Azerbaijan conducts extensive research on the problem of collecting and increasing wheat species and varieties, protection of biodiversity of the genetic fund. Biomorphological and economic indicators of collected 2158 wheat genotypeswere studied in detail. Their tolerance to biotic and abiotic stress factors is determined, the utilization of genotypes with beneficial properties in breeding is recommended [7, 8, 9, 10]. Our research is a part of the solution to this problem.
Materials and research methods
The study was conducted on 31 samples of 18 durum wheat varieties.
In order to study the relationship between the wheat genotypes tolerance to salinity and drought stress and the amount of chlorophyll, leaf samples (second leaf down from top ear) were obtained to from field experiments and exposed to salt and drought stress in the laboratory conditions. For this purpose, small disks were cut from the section of the leaves and divided into three experiment variants. In each experimental variant, 5 disks were placed into the test tubes. The first experiment was carried out in water, the second in 2 % NaCl solution, the third part in sucrose solution with 20 ap and kept at 24 °C for aday.Then the disks was removed from the solution, dried with filter paper and transferred to a 10 mltest tubealcohol and boiled for a few minutes (until the disks turned white).
After cooling, the volume of alcohol in the test tube was brought up to 10 ml and the amount of chlorophyll was measured on a spectrophotometer at the wavelength of 665 nm for chlorophyll “a” and 649 nm for chlorophyll “b”. The ratio of pigment concentration in the salt and drought variants to the water variant was found, and this ratio was accepted as a measurement criteria for the selection of salt, drought-tolerant forms. The samples with the high results, are considered as the more tolerant samples [11, 12]. In addition, in the grains of the samples were determined physical parameters – the gluten quantity, sediment quality. Grain glassiness, 1000 grains weight were studied by accepted methods (DS-10842-64, 10840-64), based on the gluten quantity and quality (DC-9406-60). The gluten quality was assessed for flour strength and stickiness (strength is measured using the GDI-1 device). Sedimentation index was determined by acetic acid on the basis of macromethod.
Research results and discussion
The results of studies on the amount of chlorophyll in the leaves of durum wheat samples are given in Table 1. The results of the study in Table 1 show the chlorophyll “a”, “b” in the leaves of wheat varieties exposed to drought and salt stress, the sum of “a” and “b”, the ratio of “a” to “b”.
Pigments take part in the transferring of oxygen in the process of photosynthesis, oxidative and photosynthetic phosphorylation, in short, in the general metabolism of the plant organism. Chlorophylls (especially chlorophyll “b”) play an important role in the plant’s adaptation toadverse environmental factors. During adaptation, decrease or increase in the ratio of chlorophyll “a” to “b” is seriously exposed in the physiological processescaused in the plant.
Using these factors, it is possible to use them in the breeding process, both in the selection of initial material, as well as in the evaluation of new hybrids, lines and varieties, and in the identification of promising forms.
According to the indicators of chlorophyll “a + b” in Table 1, 12 drought-tolerant samples and 16 salt-tolerant samples were selected, they are indicated in the table by (-).
Among the selected samples, v. muticoleucurumwas selected due to the high photochemical activity of chloroplasts. In this sample, the chlorophyll “a” was 2.71 Mcg in the control variant, 3.02 mcg in the drought variant, and 3.99 mcg in the salinity variant. The indicators of chlorophyll “b” were 1.10 mcg in the control, 1.61 mcg in the drought and 2.20 mcg in the salinity variant. Based on the results, the percentage of chlorophyll (a + b) in this sample was 121 for control and 162 in the salinity variant, and this sample was selected as a tolerant sample due to the high photochemical activity of the leaves of this sample.
Theratio of chlorophyll “a” to “b” in the leaves is significant in assessing the drought and salinity tolerance of plants. An increase in the amount of chlorophyll “a”, especially “b”, expands their ability to absorb energy from specific wavelengths of light. The high ratio of chlorophyll “a” to “b” after drought and salt stress was observed among the 8 samples: v. obscurumin K-14; v. alboobscurum in K-28; v. melanopusin K-54; v. leucomelanin K-59, v. muticoalecsandrinumin K-62, v. hordioformein K-96, v. leucurumin K-99. Selected samples are shown in the table with (-). 6 samples were selected as a tolerant to both stresses (drought, salt) (fig. 1).
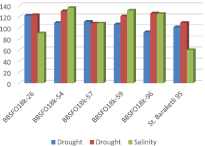
Fig. 1. The samples with the most tolerance to drought and salt stress
Comparing to others, these samples have a more active pigment complex. They are distinguished by a high content of photosynthetic pigment Table 1. Based on the literatur the photosynthetic apparatus of these samples is very active, and the process of converting light energy into chemical energy (ATF and HADF forms) is more intensive.
In addition, the gluten quantity and quality in the grains, sedimentation were determined. The indicators of the samples examined for glassiness traitwere almost as high. In 25 of the 31 samples, glassiness was high, and in 14 samples the 1000 grains weight was more than 50 grams ((v. erythromelan 59,2 qr, v. leucomelan 63,6 qr, v.melanopus 67,0 qr. v. hordeiformeetc.). The obtained results are given in Table 2.
Due to the very hot and dry weather, glutenquality was lower than in previous years. The gluten quantity in the samples was more than 30 % in 17 samples ((v.muticoleucurum46,0 %, v. muticohordeiforme 41,1 %, v. murciense 41,2 %, v. melanopus 37,0 %). The results are given in Table 2.
As a result of the experiments in Tables 1, 2, cluster statistical analysis was used. Cluster analysis determines the closeness of the samples according to the studied treat based on accurate statistical calculations.
Table 1
Indicators of tolerance to drought and salinity due to changes in the amount of chlorophyll in the leaves of durum wheat (T. durum Desf.)
|
№ |
Catalogue № |
Sample name |
Amount of chlorophyll (in one leaf in Mkg) |
Ca + Cb and Ca/Cb indicators: (according to control in %) |
||||||||
|
Control |
Drought |
Salinity |
Drought |
Salinity |
||||||||
|
a |
b |
a |
B |
a |
b |
a + b |
a/b |
a + b |
a/b |
|||
|
1 |
BBFS017K-1 |
v. muticoleucurum |
2,71 |
1,10 |
3,02 |
1,61 |
3,99 |
2,20 |
121- |
76≡ |
162- |
73≡ |
|
2 |
BFSO17k-5 |
v. muticohordeiforme |
7,61 |
2,58 |
7,01 |
1,76 |
6,46 |
2,09 |
86≡ |
135- |
84≡ |
105= |
|
3 |
BBFSO18 k-4 |
v. murciense |
7,3 |
0,57 |
1,73 |
0,53 |
2,18 |
0,87 |
98= |
107- |
132- |
82≡ |
|
4 |
BBFSO18 k-8 |
v. murciense |
1,73 |
0,69 |
1,80 |
0,84 |
2,75 |
1,36 |
170- |
81≡ |
109= |
85≡ |
|
5 |
BBFSO17k-15 |
v. affine |
1,87 |
0,70 |
2,00 |
0,65 |
2,96 |
0,84 |
97= |
115- |
138- |
132- |
|
6 |
BBFSO17k-18 |
v. mutmurciense |
1,78 |
0,68 |
2,09 |
0,84 |
2,75 |
1,12 |
119- |
95= |
157- |
94≡ |
|
7 |
BBFSO18k-14 |
v. obscurum |
7,04 |
2,78 |
8,53 |
2,58 |
8,59 |
2,30 |
113- |
130- |
111- |
147- |
|
8 |
BBFSO18k-58 |
v. hordeiforme |
6,84 |
2,54 |
7,37 |
2,90 |
8,70 |
2,52 |
109= |
94= |
119- |
128- |
|
9 |
BBFSO18k-59 |
v. melanopus |
7,99 |
3,21 |
7,38 |
2,85 |
8,44 |
3,09 |
91= |
104- |
103= |
110- |
|
10 |
BBSFO18k-24 |
v. africanum |
7,51 |
2,74 |
1,86 |
1,09 |
2,58 |
0,84 |
131- |
83≡ |
152- |
150- |
|
11 |
BBSFO17k-33 |
v. mutv. lubicum |
7,09 |
2,08 |
7,64 |
2,16 |
8,23 |
2,40 |
106= |
103= |
116- |
100= |
|
12 |
BBSFO18k-27 |
v. niloticum |
7,78 |
2,90 |
8,45 |
2,95 |
8,35 |
2,89 |
107= |
107= |
105= |
107= |
|
13 |
BBSFO18k-26 |
v. obscurum |
1,22 |
0,46 |
1,57 |
0,48 |
6,13 |
1,76 |
122- |
123- |
116- |
90≡ |
|
14 |
BBSFO17k-28 |
v. alboobscurum |
1,65 |
0,66 |
4,71 |
1,40 |
2,50 |
0,65 |
91≡ |
136- |
170- |
153- |
|
15 |
BBSFO18k-26 |
v. alboobscurum |
6,01 |
1,75 |
6,69 |
1,92 |
6,56 |
1,76 |
110- |
101= |
107= |
107= |
|
16 |
BBSFO18k-52 |
v. niloticum |
1,36 |
0,38 |
2,00 |
0,70 |
2,23 |
0,80 |
155- |
174- |
79≡ |
77≡ |
|
17 |
BBSFO18k-53 |
v. murciense |
6,54 |
2.07 |
7,83 |
2,34 |
7,81 |
2,38 |
118- |
118- |
105= |
104= |
|
18 |
BBSFO18k-54 |
v. melanopus |
4,52 |
1,79 |
5,28 |
1,60 |
7,21 |
2,10 |
109= |
130- |
147- |
136- |
|
19 |
BBSFO18k-55 |
v. erythromelan |
5,95 |
2,33 |
6,18 |
2,45 |
6,37 |
2,46 |
104= |
98≡ |
106= |
101= |
|
20 |
BBSFO18k-57 |
v. apulicum |
6,07 |
2,37 |
7,53 |
1,90 |
7,21 |
2,60 |
111- |
108= |
116- |
108= |
|
21 |
BBSFO18k-59 |
Leucomelan |
5,49 |
2,22 |
6,16 |
2,05 |
7,02 |
2,17 |
106= |
121- |
119- |
131- |
|
22 |
BBSFO18k-60 |
v. hordeiforme |
5,53 |
2,17 |
5,37 |
1,77 |
6,09 |
2,27 |
93≡ |
109- |
116- |
103= |
|
23 |
BBSFO18k-49 |
v. murciense |
7,65 |
2,54 |
7,77 |
2,28 |
7,94 |
3,60 |
98≡ |
113- |
113- |
73≡ |
|
24 |
BBSFO18k-62 |
v. mutv. alexsadrinum |
1,51 |
0,74 |
2,23 |
0,80 |
2,93 |
0,86 |
134- |
168- |
136- |
166- |
|
25 |
BBSFO18k-64 |
v. melanopus |
2,06 |
0,44 |
2,23 |
0,80 |
3,20 |
0,71 |
121- |
58≡ |
156- |
96= |
|
26 |
BBSFO18k-73 |
v. mutv. apulicum |
1,92 |
0,51 |
2,30 |
0,99 |
2,93 |
0,86 |
135- |
61≡ |
155- |
90= |
|
27 |
BBSFO18k-96 |
v. hordeiforme |
3,09 |
1,23 |
2,87 |
1,12 |
4,14 |
1,31 |
92≡ |
126- |
101= |
125- |
|
28 |
BBSFO18k-97 |
v. hordeiforme |
2,46 |
0,78 |
3,30 |
1,39 |
3,92 |
0,99 |
144- |
75≡ |
151- |
126- |
|
29 |
BBSFO18k-99 |
v. leucurum |
1,36 |
0,38 |
1,86 |
0,77 |
2,64 |
0,58 |
151- |
185- |
67≡ |
127- |
|
30 |
St. Barakatli 95 |
v. hordeiforme |
8,95 |
2,95 |
9,30 |
2,80 |
6,04 |
3,27 |
101= |
109= |
78≡ |
60≡ |
Notation keys: – tolerant; = moderate; ≡ susceptible
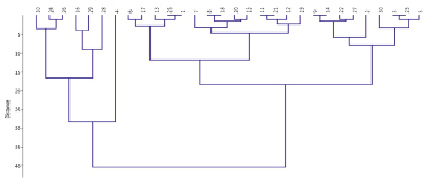
Fig. 2. Grouping of samples according to the amount of chlorophyll (a + b) under the influence of drought stress
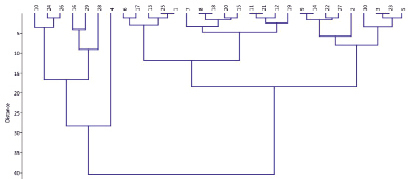
Fig. 3. Grouping of samples according to the amount of chlorophyll (a + b) due to the salt stress
To summarize the results, the samples were grouped in a dendrogram according to the changes in the amount of chlorophyll (a + b) caused by drought. In the dendrogram, the samples were classified into three groups: tolerant samples ingroup 1 (high chlorophyll content in the leaves with a high percentage of control: K-24, 62, 73, 52, 99, 97, 53, 26, 64, 1). Group 2 includes the samples with less than 90 % chlorophyll according to control. (K-54, 58, 49, 15, 22, 26). The amount of chlorophyll in the leaves of these samples was reduced due to the drought. The third group of samples was assessed as susceptible to drought due to changes in amount of chlorophyll (a + b) (k-5; k-60; k-96; k-27; k-59).
In Fig. 3, the studied samples are grouped according to their salinity tolerance. The dendrogram shows samples, closein terms of tolerance. In the upper group, the samples with chlorophyll (a + b) ratios of 152–136 % were considered as salinity-tolerant samples (K-24, 73, 97, 18, 64, 1, 59, 58, 57). The percentage of chlorophyll (a + b) in the leaves of the subgroup samples (K-5, St, 96, 59, 60, 55, 26) according to the control was 105-84 after stress. These samples were evaluated as drought susceptible.
Comparing to others, these samples have a more active pigment complex. They are distinguished by a high content of photosynthetic pigment (Table 1). Based on the literature the photosynthetic apparatus of these samples is very active, and the process of converting light energy into chemical energy (ATF and HADF forms) is more intensive.
In addition, the gluten quantity and quality in the grains, sedimentation were determined. The indicators of the samples examined for glassiness were almost as high. In 25 of the 31 samples, glassiness was high, and in 14 samples the 1000 grains weight was more than 50 grams ((v. erythromelan 59,2 gr, v. leucomelan63,6 gr, v.melanopus67,0 gr. v. hordeiformeetc.). The results are given in Table 2.
Due to the very hot and dry weather, gluten quality was lower than in previous years. The gluten quantity in the samples was more than 30 % in 17 samples ((v. muticoleucurum 46,0 %, v. muticohordeiforme 41,1 %, v. murciense 41,2 %, v. melanopus 37,0 %). The results are given in Table 2.
At the same time, the amount of dry gluten in the samples was determined. Thus, the ratio between wet gluten and dry gluten was about 3: 1.
In Table 3, 9 genotypes with high values are given together with the results of Barakatli-95 varieties taken as standard.
3 of 31 samples, were found to have a pattern between the physical characteristics of the seeds and tolerance (v.niloticum in K-26; v.melanopus in K-64; muticoapulicum in K-73). The seeds of these samples have high indicators in terms of 1000 seeds weight, the quality of gluten, flour resistance and viscosity.
Conclusion
Based on the changes in the plastid apparatus of the leaves, it was determined from the studied durum wheat samples of Standard Barakatli-95; : K-19 obscurum; K-26 alboobscurum; K-54 melanopus; K-57 apulicum; K-59 leucomelan; K-96 hordeiforme are drought-salinity tolerant samples and can be used as donors in breeding works for tolerance.
Table 2
Physical indicators durum wheat genotypes
|
Catalogue № |
Sample name |
Physical indicators |
Gluten quantity and quality |
||||
|
Glass. % |
1000 se. w. gr |
Viscosi.cm. |
Quantity. % |
GDI |
Dry gluten quantity |
||
|
BBFS017k-1 |
v. mut.leucurum |
100 |
36.4 |
10 |
46.0 |
85 |
20.0 |
|
BBFS017k-5 |
v. mut.hordeiforme |
100 |
45.6 |
11 |
40.1 |
85 |
16.4 |
|
BBFS017k-6 |
v. murciense |
99 |
43.2 |
9 |
34.8 |
100 |
14.0 |
|
BBFS017k-7 |
v. murciense |
100 |
38.4 |
8 |
41.2 |
100 |
16.6 |
|
BBFS017k-15 |
v. affine |
92 |
44.8 |
10 |
28.5 |
105 |
11.6 |
|
BBFS017k-18 |
v. mut.murciense |
100 |
39.2 |
11 |
40.6 |
105 |
16.4 |
|
BBFS018k-14 |
v. obscurum |
96 |
47.2 |
8 |
32.0 |
100 |
11.8 |
|
BBFS018k-58 |
v. hordeiforme |
97 |
51.2 |
12 |
27.3 |
105 |
11.0 |
|
BBFS018k-59 |
v. melanopus |
100 |
47.2 |
13 |
37.0 |
115 |
17.3 |
|
BBFS018k-24 |
v. africanum |
85 |
52.0 |
9 |
28.1 |
110 |
12.1 |
|
BBFS017k-25 |
v. melanopus |
99 |
42.8 |
8 |
33.2 |
100 |
12.8 |
|
BBFS017k-33 |
v. mut.lybicum |
98 |
55.6 |
8 |
32.8 |
100 |
12.6 |
|
BBFS018k-26 |
v. niloticum |
100 |
46.8 |
11 |
37.4 |
105 |
13.2 |
|
BBFS017k-6 |
v. obscurum |
94 |
37.2 |
15 |
30.4 |
110 |
12.3 |
|
BBFS018k-26 |
v. obscurum |
95 |
39.2 |
89 |
23.7 |
110 |
9.4 |
|
BBFS018k-28 |
v. alboobscurum |
92 |
42.0 |
10 |
28.3 |
100 |
10.0 |
|
BBFS018k-26 |
v. alboobscurum |
96 |
41.6 |
10 |
25.0 |
115 |
10.0 |
|
BBFS018k-52 |
v. niloticum |
96 |
48.4 |
11 |
30.4 |
100 |
10.8 |
|
BBFS018k-53 |
v. murciense |
84 |
50.4 |
8 |
26.0 |
100 |
9.0 |
Table 3
Durum wheat samples selected for high indicators
|
Catalogue № |
Sample name |
Glass. %- |
1000g.w gr |
Stick..sm |
Quantity % |
GDI |
Dry weight . % |
|
BBFS018k-55 |
v. erythromelan |
92 |
59.2 |
11 |
27.6 |
105 |
10.1 |
|
BBFS018k-57 |
v. apulicum |
64 |
52.0 |
9 |
22.7 |
115 |
7.5 |
|
BBFS018k-59 |
v. leucomelan |
81 |
63.6 |
8 |
22.5 |
110 |
7.2 |
|
BBFS018k-60 |
v. hordeiforme |
93 |
62.0 |
11 |
30.0 |
110 |
10.0 |
|
BBFS018k-49 |
v. murciense |
81 |
50.6 |
5 |
20.0 |
110 |
8.0 |
|
BBFS018k-62 |
v. alexsandrinum |
98 |
54.4 |
10 |
29.5 |
115 |
12.8 |
|
BBFS018k-64 |
v. melanopus |
100 |
67.0 |
13 |
38.4 |
115 |
16.3 |
|
BBFS018k-73 |
v. mut. apulicum |
100 |
53.2 |
10 |
37.2 |
110 |
15.2 |
|
BBFS018k-96 |
v. hordeiforme |
99 |
51.2 |
9 |
33.7 |
110 |
13.4 |
|
BBFS018k-97 |
v. .hordeiforme |
96 |
52.4 |
10 |
30.4 |
110 |
12.0 |
|
BBFS018k-99 |
v. leucurum |
80 |
44.0 |
10 |
24.1 |
115 |
10.4 |
|
St. Barakatli 95 |
97 |
41.2 |
11 |
37.2 |
115 |
14.7 |
The traits of the studied wheat genotypes are included in breeding programs to help breeders achieve high yields.