

Nowadays in the arsenal of biomedical science researches we can find methods which allow us to obtain information about basic metabolic pathways in the body, however, there is virtually no data system to assess the molecular basis of metabolism, the endogenous nature of factors that determine the physiological level of the pathways and the specifics of the individual reactions. Over the last ten years the study of protein interactions with small molecules, natural metabolites in particular, was delayed compared to the study of other types of interactions such as protein-protein, protein-DNA and protein-RNA [1]. For a long time lactate was considered only as a dead-end metabolite of anaerobic catabolism of glucose [6]. However, changes of the level of lactate in liquids of the organism are typical for many syndromes [2, 7]. In earlier studies we have shown the role of such low molecular weight metabolites as pyruvate, ethanol and lactate in metabolism and their effects on protein-protein interactions [3, 4].
Laser scanning confocal microscopy is one of the promising methods that allows to study objects at the cellular, subcellular levels. In the surveyed literature there are no data describing the use of confocal microscopy in studying and visualizing the interaction of protein structures. All the above defined the purpose of our study: to visualize and quantitatively evaluate the effect of the minor metabolism component – lactate – on the process of intermolecular interactions using laser scanning confocal microscopy.
Materials and methods of research
Visualization of protein-protein interaction was carried out using an experimental stand, which was implemented on the basis of a confocal optical microscope and a laser harvester company ANDOR (scanning speed up to 25 layers per second). This stand allows to perform microphotograping in two modes: the mode of confocal microscopy in visible light and the mode of laser fluorescence. In the first case, as the source of radiation we used a broadband source (halogen lamp), in the second case we used laser emitters with a power of 100 mW at wavelengths of 488 nm and 561 nm.
Additionally the processing of noise pixels of the collected microphotographs was carried out. To reduce noise and increase the contrast of microphotographies we used a filter with a threshold of about 5 % of the maximum intensity of the frame and replace it with a null signal. Evaluation of image area occupied by aggregates was performed using Andor IQ.
The object of the study was the molecular АВ0 blood groups model with subsequent study the effect of the small molecule lactate on the antigen-antibody interaction (patent for invention № 2484480 of 10.06.2013). We studied the spatial structure of АВ0 blood system antigens: on the erythrocyte membrane of A(II) blood group there is A-antigen – a glycoprotein with terminal N-acetylgalactosamine, on the membrane of erythrocytes of B(III) blood group there is B-antigen – glycoprotein with terminal galactose[1, 8]. After counting the number of red blood cells in the hematology analyzer, whole blood was diluted with a solution of FAX flow up to the approximate red blood cells content 1х106/l. The composition of the salt solution FAX flow: KH2PO4 – 0,02 %, Na2H PO4 – 0,21 %, NaCl – 0.8 %, And KCl And 0.01 %, Na2EDTA – 0,03 %, H2O – 98,9 %. Before the reaction of hemagglutination, 100 µl of erythrocytes were incubated with 20 µl of lactate at a final concentration of 2 mm for 5 minutes. Then the reaction of antigen-antibody with specific monoclonal conjugated antibodies Blood group A antigen (Z2A), Blood group B antigen (89-F) labeled with fluorescein isothiocyanate (FITC) Santa Cruz biotechnology, Inc. (USA) in vitro for 20 minutes in a dark place was carried out, after that it was thoroughly mixed by vortex, and 2 ml FAX flow was added and the registration of images in a model environment was performed. We used conjugated with marker antibodies and glycoproteins A and B incubated with a solution of lactate in a dilution of 1:5, diluted glycoproteins A and B without lactate were used as the control probes.
Results of research and their discussion
During the study, we obtained electron micrographs in the primary dispersion. We evaluated the results of the intermolecular interaction: the amount of square frame and the square formed by the aggregates. At the first couple of photos we can see the result of antigen-antibody interaction with A glycoprotein without the introduction of lactate (Fig. 1, A) and after the addition of lactate (Fig. 1, B). At the figure 1B it shows the active formation of complexes that are superior in number and value of conglomerates formed without the influence of lactate. We can notice an increase of the frame occupied by aggregate 4.7 % in the control group to 19.4 % in the experimental group when adding lactate. Along with increasing the frame size the area of formed aggregates also increases: for the control group this size was 67.4 µm2, while for the experimental group it was 152 µm2. The introduction of lactate in the antigen-antibody system exerts an activating influence on the processes of protein-protein interactions that can be explained by the peculiarities of the interaction of lactate with the antigenic determinant of the red blood cells of the first group of blood.
Adding lactate to the system with the glycoprotein B (Fig. 1 C, D) shows less tendency to form complexes. Not-interacting with monoclonal antibodies single red blood cells dominated in the picture. The volume of the frame occupied by the aggregates of erythrocytes in the control group amounted to 14.1 %, while the introduction of lactate in the experiment resulted to decreasing the formation of complexes to 2.9 % of the total frame, respectively. We also observed a slight decrease in the area of the formed aggregates under the influence of lactate: 44,8 µm2 in the control group compared to 42.2 µm2 for the experimental group.
Comparing complexes obtained by the interaction of lactate with the glycoproteins A and B showed a difference in the size and shape of the complexes (Fig. 1 B, D). The complexes formed by lactate with antigen A were characterized by large size (average value of the complex 152 µm2), complex shape, high number of subunits in each complex, while the complexes formed with antigen B were characterized by fewer complexes of small magnitude (middle value of the complex of 42.2 µm2) with a small number of subunits.
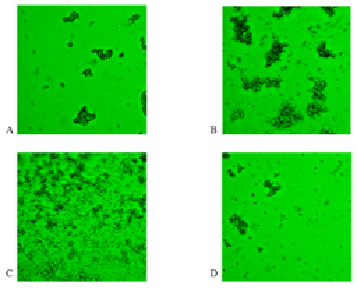
Fig. 1. Electron micrograph of the glycoproteins A and B interaction with monoclonal antibodies in native mode dispersion (magnification 400). A – glycoprotein A (control sample); B – glycoprotein A after incubation with lactate; C – glycoprotein B (control sample); D – glycoprotein B after incubation with lactate
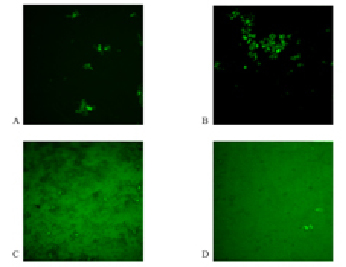
Fig. 2. Photomicrographs of complexes formation of antigen-antibody glycoproteins A and B in the regime of fluorescence (400x). A – glycoprotein A (control sample); B – glycoproteins A after incubation with lactate; C – glycoprotein B (control sample); D – B glycoproteins after incubation with lactate
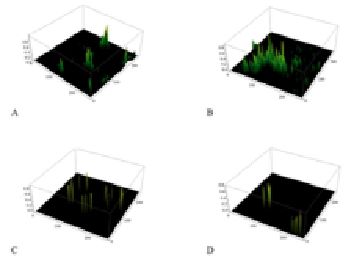
Fig. 3. Diagrams of the spatial distribution of the fluorescence intensity in the complexes antigen – antibody. A – control red blood cells of A(II) blood group; B – red blood cells of A(II) blood group after incubation with lactate; C – control erythrocytes of B(III) blood group; D – erythrocytes of B(III) blood group after incubation with lactate
Confocal microscopy in the fluorescence mode is an important stage of the research, as it allows us to fully explore the processes of specific antigen-antibody interaction, excluding cases of non-specific interactions. On the photomicrographs, made in the fluorescence mode (Fig. 2), we can see complexes consisting of subunits with FITC emitting glow. Analysis of the data indicates a significant increase in the formation of antigen-antibody complexes for A glycoprotein in the experimental probe with the addition of lactate (Fig. 2, B). While the introduction of lactate in the antigen-antibody system with glycoprotein B leads to a decrease in complex formation (Fig. 2, D). Net frame containing complexes of glycoproteins with addition of lactate was 6.7 % for antigens A and 0.3 % for B antigens, respectively. Conducting a comparison of the surface area of the obtained complexes we can notice the predominance of the complexes formed by the introduction of lactate to glycoprotein A 50.4 per µm2 in comparison with the results obtained by the introduction of lactate to glycoprotein B – the average size of the conglomerate amounted to 17.7 µm2.
The study of the spatial fluorescence intensity distribution of fluorochrome luminescence in the complexes of antigen-antibody (Fig. 3) shows a significant increase of the fluorescence peaks in A glycoprotein with lactate incubation (Fig. 3, B). It can be assumed that in the structure of the antigen A there is an area responsible for binding with lactate, so its accession to the antigen does not compete for binding with other ligands. Moreover, binding lactate in the active site, appears to be capable of changing the conformation of the glycoprotein increasing the efficiency of antigen-antibody interaction. At the same time, the introduction of lactate in the system with the glycoprotein B (Fig. 3, D) causes a decrease of the fluorescence peaks. This may be due to differences in the structure of structure of the antigen B. Probably lactate competes for the active sites of a given antigenic determinants, leading to inefficient conformational rearrangements and reducing the amount of complexes antigen-antibody formation.
Conclusions
Thus, using the technique of laser scanning confocal microscopy, it is possible not only to visualize protein structures but also to quantify the changes caused by lactate with its introduction into the experimental system. Applying natural intermediates as molecular probes allows us to determine the biological effects of these compounds and the molecular nature of the regulated relations. Glycoprotein A leads to probably high sensitivity A(II) blood group to external factors that appears to be the molecular background of the frequent infectious diseases occurrence in this group. Glycoprotein B is less susceptible to the influence of lactate that reveals the molecular mechanism of the B(III) blood groups stability in the perception of foreign substances and explains the high stability of the persons in the group of blood to the viruses and infectious agents. The data reveal causes of individual reactions to exogenous and endogenous factors associated with different blood groups. This is important for preventive medicine and it contributes to our understanding the processes of reception, intermolecular recognition in health and disease, in terms of the accumulation of oxidized products of metabolism, and it may also allow patients to adequately assess the laboratory studies on the basis of ligand technology.
1. With laser scanning confocal microscopy we managed to visualize protein-protein interaction and to evaluate the influence of lactate.
2. The opposite influence of the natural metabolite to the glycoproteins A and B was established.
3. Lactacidemia in a number of diseases can cause pathochemical changes of metabolism.
4. When performing high-tech sensitive methods (ELISA, immunofluorescence) it is important to take into account the possibility of results distortions in the blood analysis in case of elevated minor components of metabolism level.